Industrial Properties
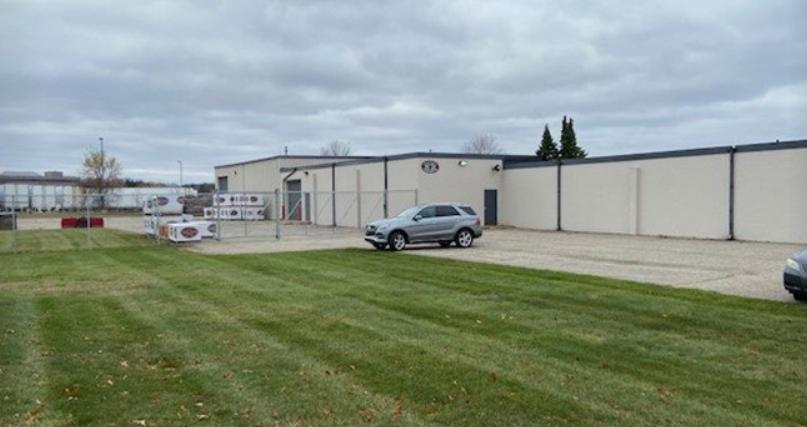
900 40th Street Southeast Grand Rapids, MI 49508
900 40th Street Southeast Grand Rapids, MI 49508

Details & Description
Listing Agents

Christopher Prins
O: 616-776-0100
M: 616-292-8781
chrisp@naiwwm.com
O: 616-776-0100
M: 616-292-8781
chrisp@naiwwm.com

David Smies
O: 616-242-1122
M: 616-821-5385
daves@naiwwm.com
O: 616-242-1122
M: 616-821-5385
daves@naiwwm.com
While we strive to provide the most accurate information, all listing information, and demographic data, is provided by third-parties. As such, MyEListing will not be responsible for the accuracy of the information. It is strongly recommended that you verify all information with the listing agent, and any relevant agencies, prior to making any decisions.