San Jose Plaza
1601 Broadway Blvd. SE
Albuquerque, NM 87102
OFFERING SUMMARY
Purchase Price: $689,000
Price per SF: $114.45/SF
Net Operating Income: $50,443
Cap Rate: 7.32%
Lease Type: Modified Gross
INVESTMENT HIGHLIGHTS
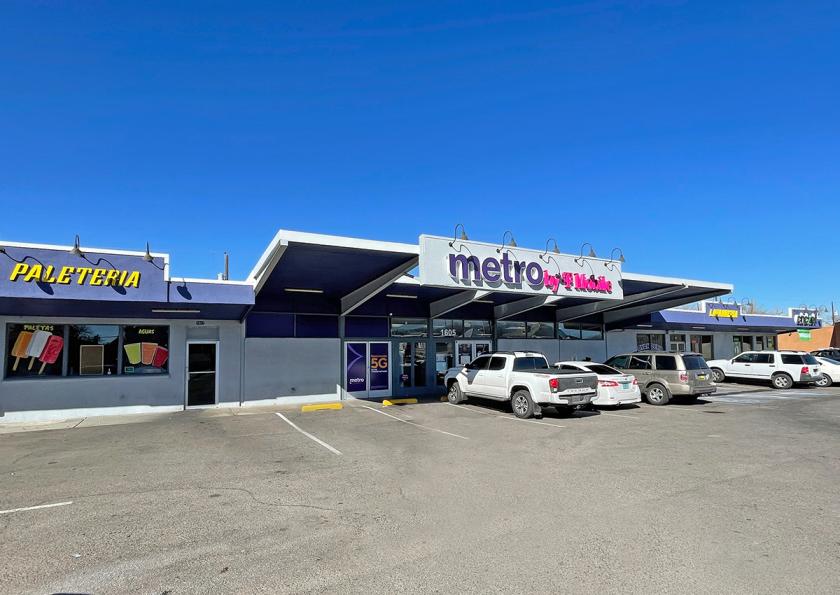
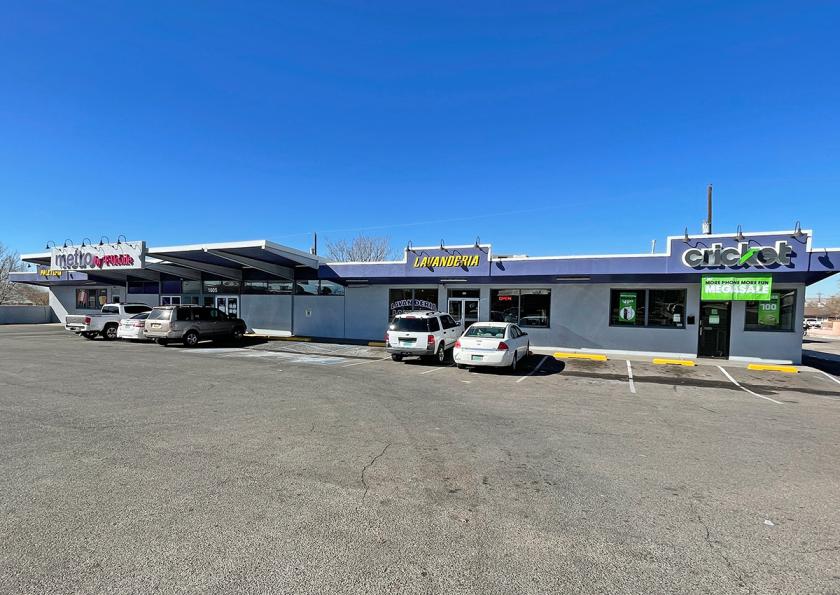
100% Occupied Retail Strip Center
Stabilized asset with recently extended leases
– Long tenured tenants
– Cricket, Metro by T-Mobile, and the laundromat have each recently signed five-year extensions
Building Size: ± 6,020 SF
Land Size: ± 0.48 acres
Low, replaceable lease rates with annual rent increases
– Tenants reimburse Landlord for utility charges
Well maintained property with recent large capital expenditures exceeding $100,000
– New roof (2018)
– Building paint (2018)
– Parking lot overlay (2018)
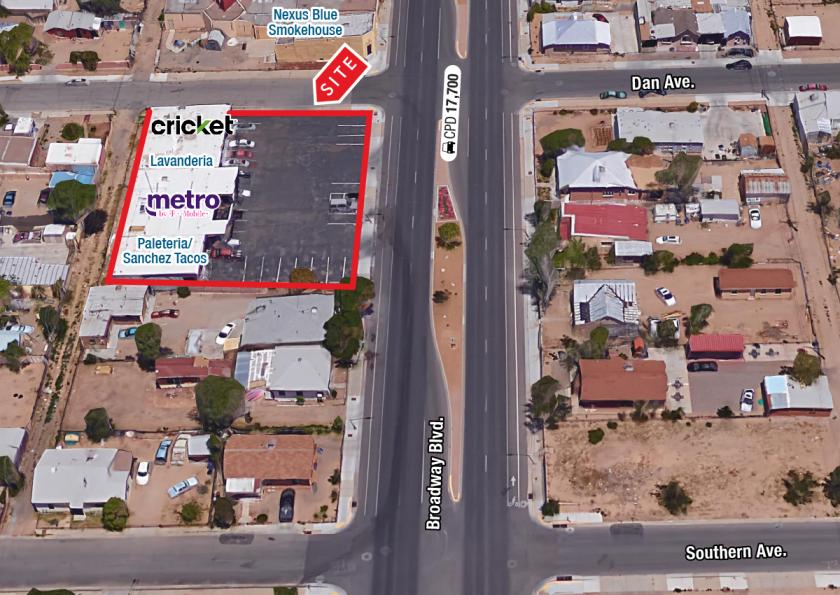
Diverse mix of tenants
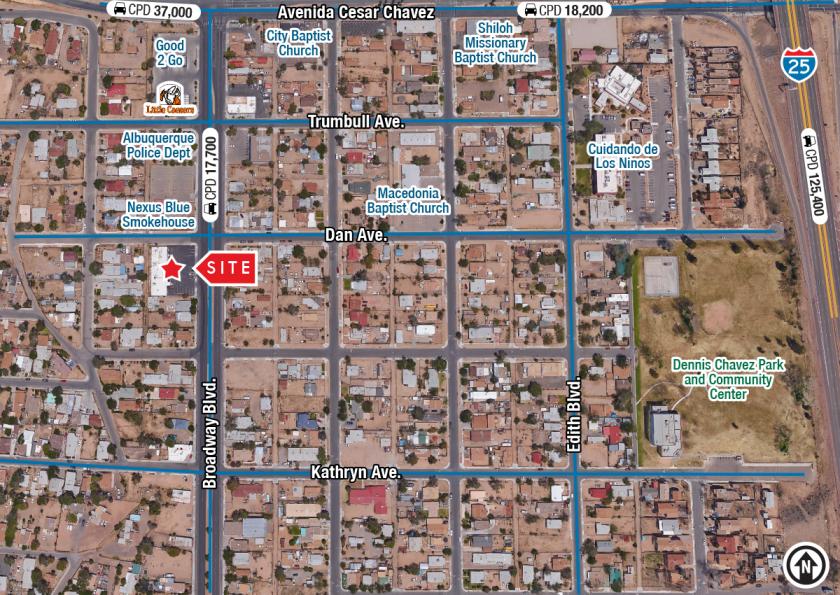
Underserved and growing trade area
Strategically located near the major intersection of Avenida Cesar Chavez & Broadway Blvd with over 54,000 Cars Per Day
No part of this information may be copied, reproduced, repurposed, or screen-captured for any commercial purpose without prior written authorization from MyEListing.
While we strive to provide the most accurate information, all listing information, and demographic data, is provided by third-parties. As such, MyEListing will not be responsible for the accuracy of the information. It is strongly recommended that you verify all information with the listing agent, and any relevant agencies, prior to making any decisions.
What is the asking price for 1601 Broadway Boulevard Southeast in Albuquerque?
The asking price for 1601 Broadway Boulevard Southeast is $689,000
What is the building size of this Retail property in Albuquerque, NM?
The size of the building/unit at 1601 Broadway Boulevard Southeast in Albuquerque is 6,020 square feet
How much land does the Albuquerque, NM property at 1601 Broadway Boulevard Southeast include?
1601 Broadway Boulevard Southeast in Albuquerque includes 0.500 acres of land
What kind of Retail is the propery at 1601 Broadway Boulevard Southeast?
The property at 1601 Broadway Boulevard Southeast Albuquerque, NM 87102 is listed as a Shopping Center Retail property
What is the population within 1 mile of 1601 Broadway Boulevard Southeast in Albuquerque?
The population within 1 mile of 1601 Broadway Boulevard Southeast Albuquerque, NM 87102 is 9,149 people.
Who do I contact for questions about 1601 Broadway Boulevard Southeast?
You should contact the listing agent,
Cole Flanagan, for any details regarding this commercial listing.