Industrial Properties
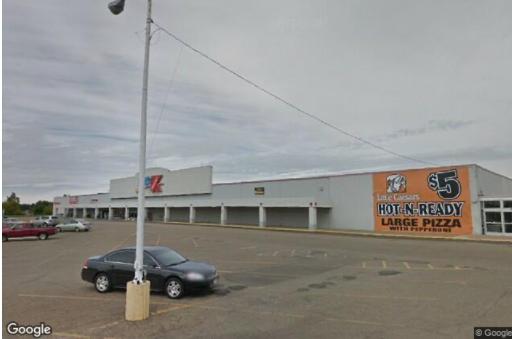
3801 Harmont Avenue Northeast Canton, OH 44705
3801 Harmont Avenue Northeast Canton, OH 44705
Details & Description
Additional Photos
Listing Agents

Sean Sanford
O: 330-284-0331
M: 330-284-0331
sean@naispring.com
O: 330-284-0331
M: 330-284-0331
sean@naispring.com

Tim Bishman
O: 330-620-8487
M: 330-620-8487
tbishman@gmail.com
O: 330-620-8487
M: 330-620-8487
tbishman@gmail.com
While we strive to provide the most accurate information, all listing information, and demographic data, is provided by third-parties. As such, MyEListing will not be responsible for the accuracy of the information. It is strongly recommended that you verify all information with the listing agent, and any relevant agencies, prior to making any decisions.


