Commercial Land
4965 - 5015 Austin Bluffs Parkway Colorado Springs, CO 80918
4965 - 5015 Austin Bluffs Parkway Colorado Springs, CO 80918

Details & Description
Property Highlights
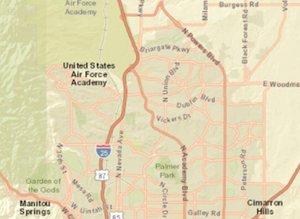
• Located in close proximity to the intersection of Austin Bluffs Parkway and Academy Boulevard
• Highly visible from Austin Bluffs Parkway with over 30,000 vehicles per day
Listing Agents

Michael Suggs
O: 719-338-4555
M: 719-338-4555
suggs@highlandcommercial.com
O: 719-338-4555
M: 719-338-4555
suggs@highlandcommercial.com

Darek Bartol
O: 719-667-6888
M: 727-631-2554
bartol@highlandcommercial.com
O: 719-667-6888
M: 727-631-2554
bartol@highlandcommercial.com
While we strive to provide the most accurate information, all listing information, and demographic data, is provided by third-parties. As such, MyEListing will not be responsible for the accuracy of the information. It is strongly recommended that you verify all information with the listing agent, and any relevant agencies, prior to making any decisions.