Specialty Real Estate
1372 New York 17B White Lake, NY 12786
1372 New York 17B White Lake, NY 12786
Details & Description
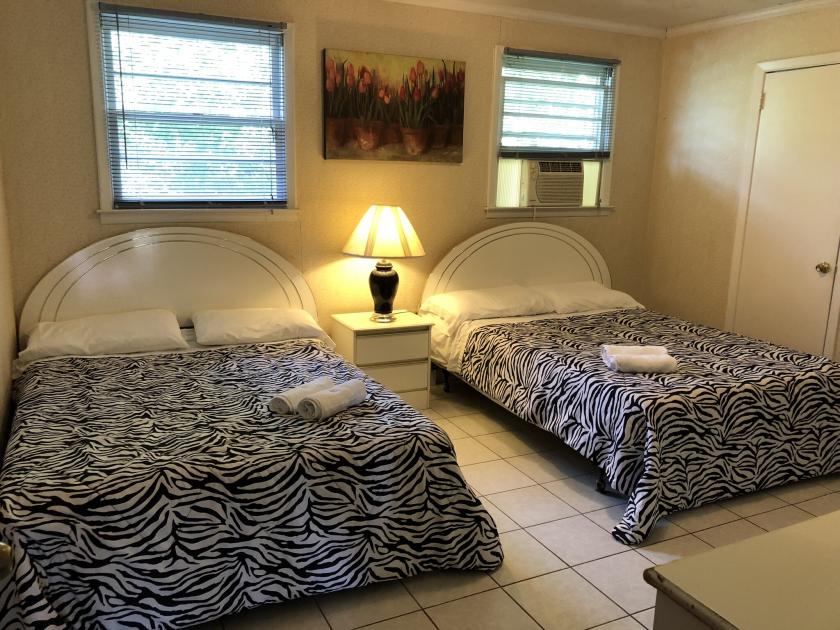
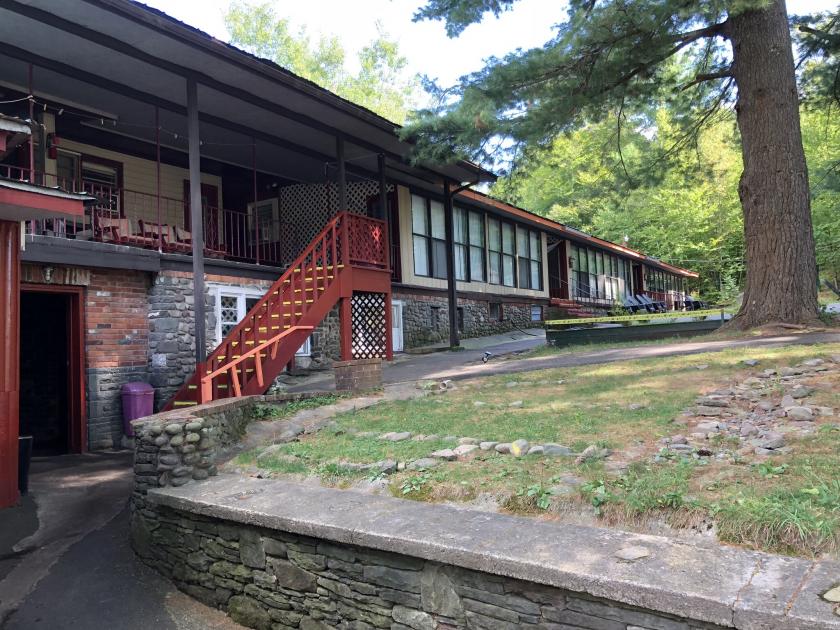
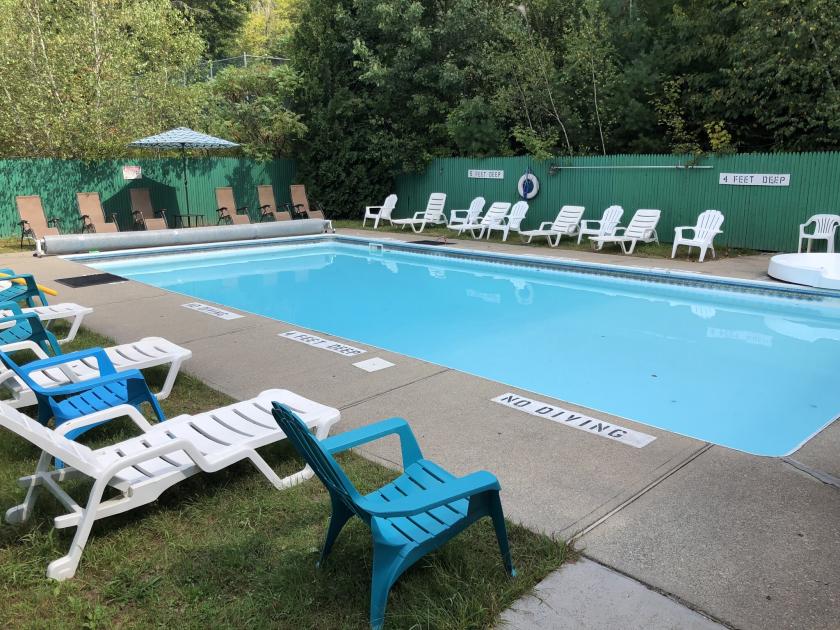
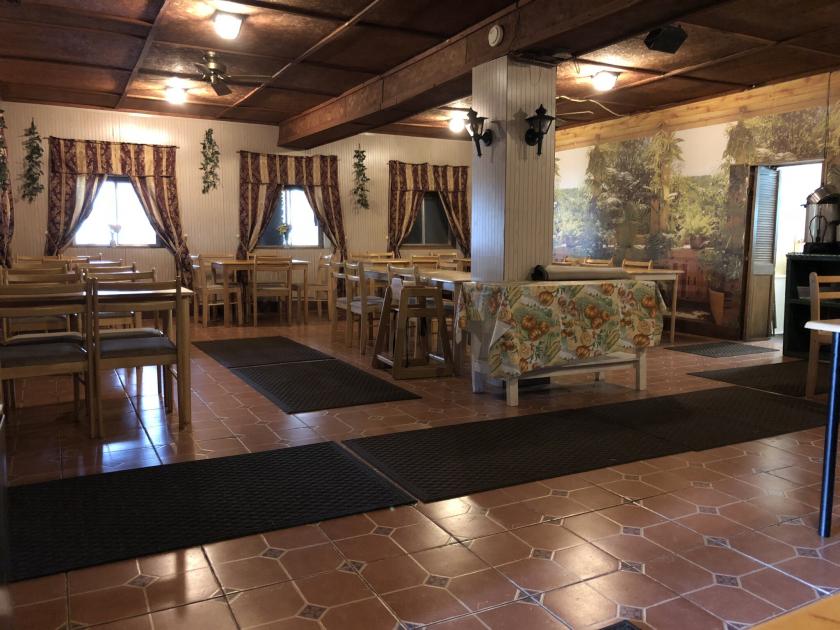
Additional Photos


Listing Agents

REGINALD STANCZYK
streggie2@cs.com
streggie2@cs.com
While we strive to provide the most accurate information, all listing information, and demographic data, is provided by third-parties. As such, MyEListing will not be responsible for the accuracy of the information. It is strongly recommended that you verify all information with the listing agent, and any relevant agencies, prior to making any decisions.