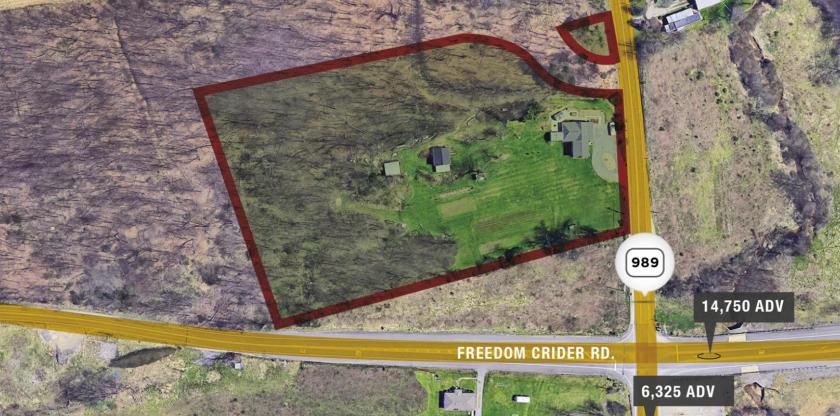
1-Mile | 3-Miles | 5-Miles | ||
---|---|---|---|---|
Total Population | 1,839 | 17,799 | 59,634 | |
Population Median Age | 54 | 45 | 42 | |
Population by Age | 0-9 Yrs | 96 (5%) | 1745 (9%) | 6848 (11%) |
10-19 Yrs | 91 (4%) | 1579 (8%) | 6215 (10%) | |
20-29 Yrs | 162 (8%) | 1578 (8%) | 6013 (10%) | |
30-39 Yrs | 137 (7%) | 2106 (11%) | 8046 (13%) | |
40-49 Yrs | 155 (8%) | 2198 (12%) | 7435 (12%) | |
50-59 Yrs | 285 (15%) | 2836 (15%) | 9174 (15%) | |
60-69 Yrs | 418 (22%) | 2754 (15%) | 8002 (13%) | |
70+ Yrs | 495 (26%) | 3004 (16%) | 7900 (13%) | |
Median HH Income | $77,528 | $78,526 | $71,956 | |
Total Household Income | < 24K | 106 (12%) | 937 (12%) | 3929 (15%) |
25-49K | 130 (14%) | 1319 (17%) | 4941 (19%) | |
50-74K | 186 (21%) | 1446 (18%) | 4265 (16%) | |
75-99K | 129 (14%) | 1154 (14%) | 3581 (14%) | |
100-199K | 286 (32%) | 2336 (30%) | 6779 (26%) | |
200K+ | 34 (3%) | 539 (6%) | 1847 (7%) | |
Highest Education Level | No Diploma | 29 | 619 | 2541 |
Diploma or GED | 512 | 4165 | 12777 | |
Some College | 288 | 2362 | 7751 | |
Assoc. Degree | 154 | 1487 | 4685 | |
Bachelors Degree | 410 | 3318 | 10609 | |
Higher Degree | 196 | 1878 | 5591 | |
Total Housing Units | 890 | 8,162 | 27,339 | |
--Owner-Occupied | 803 | 6,716 | 19,354 | |
--Renter-Occupied | 70 | 1,015 | 5,988 | |
Owner-Occupied Values | < 100K | 86 | 1024 | 4565 |
100-199K | 311 | 2517 | 6478 | |
200-299K | 246 | 1727 | 4000 | |
300-399K | 106 | 1015 | 2697 | |
400-499K | 42 | 285 | 952 | |
500K+ | 12 | 148 | 663 | |
Total Working Age Population | 1,681 | 15,074 | 48,784 | |
In Work Force | 895 | 9,631 | 31,721 | |
Not In Work Force | 786 | 5,443 | 17,063 | |
Workforce Employed | 866 | 9,340 | 30,494 | |
Workforce Unemployed | 29 | 287 | 1,214 | |
Civlian Workforce | 895 | 9,627 | 31,708 | |
Military Workforce | 0 | 4 | 13 | |
Total Households | 873 | 7,731 | 25,342 | |
Family Households | 612 | 5,411 | 16,658 | |
Non-Family Households | 261 | 2,320 | 8,684 | |
Married Couple | 536 | 4,660 | 13,682 | |
Other Family | 76 | 751 | 2,975 | |
Married w/Child | 82 | 1,396 | 4,988 | |
Single Male w/Child | 2 | 82 | 383 | |
Single Female w/Child | 1 | 156 | 989 |
Population Change Last Two Decades - Plus Projection
2000 | % | 2010 | % | 2020 | % | 2030 | |
---|---|---|---|---|---|---|---|
Pennsylvania | 12,281,054 | +3 | 12,702,379 | +4 | 13,230,170 | +4 | 13,759,594 |
Allegheny County | 1,281,666 | -5 | 1,223,348 | +3 | 1,265,919 | +3 | 1,307,654 |
Beaver County | 181,412 | -6 | 170,539 | +1 | 172,348 | +1 | 174,352 |
Butler County | 174,083 | +6 | 183,862 | +4 | 190,619 | +4 | 197,650 |
Total Working Age Population:
Total Households:
Total Working Age Population:
Total Households:
Total Working Age Population:
Total Households: