Industrial Properties
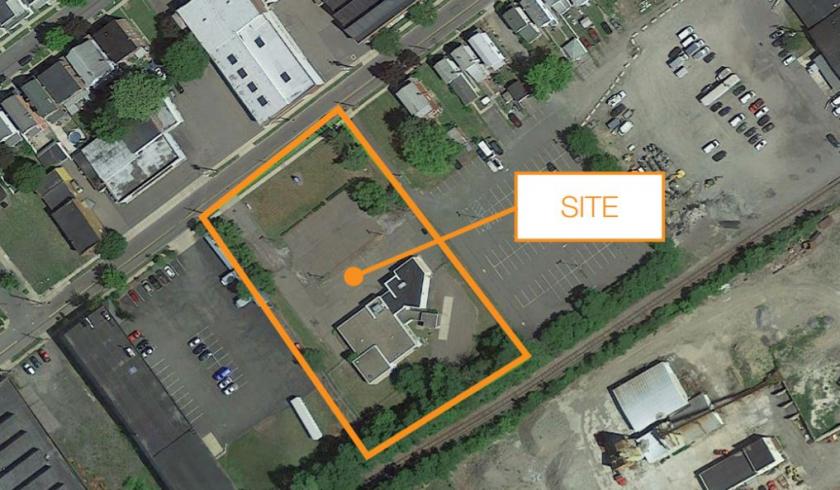
345 North Pennsylvania Avenue WilkesBarre, PA 18702
345 North Pennsylvania Avenue WilkesBarre, PA 18702
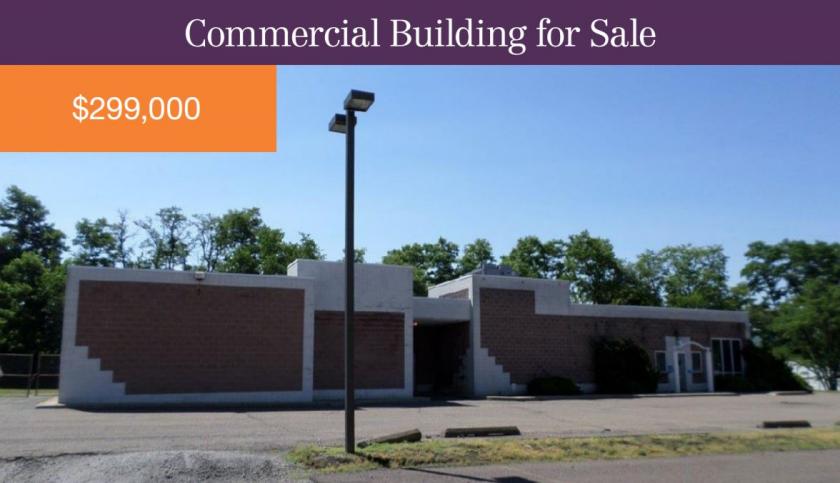
Details & Description
Listing Agents

Michael Detter
O: 570-468-8818
mdetter@geisrealty.com
O: 570-468-8818
mdetter@geisrealty.com
While we strive to provide the most accurate information, all listing information, and demographic data, is provided by third-parties. As such, MyEListing will not be responsible for the accuracy of the information. It is strongly recommended that you verify all information with the listing agent, and any relevant agencies, prior to making any decisions.