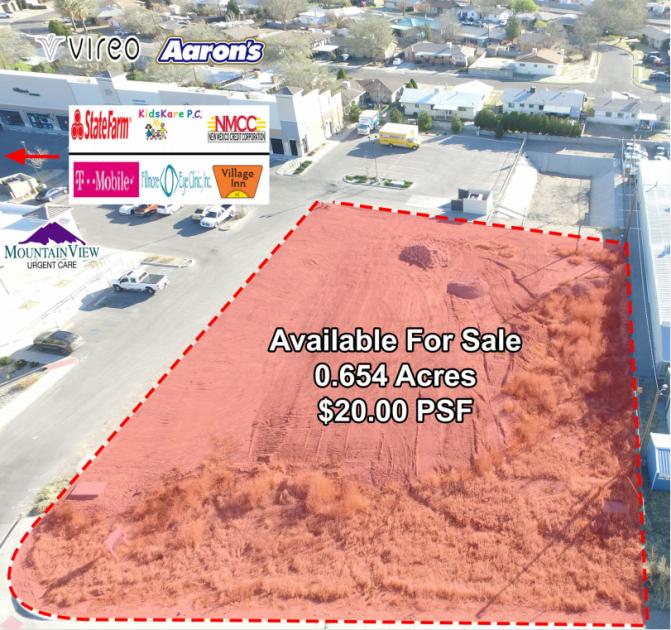
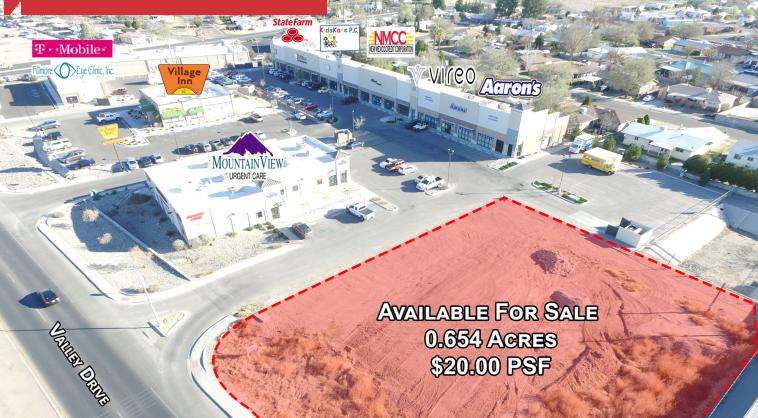
1-Mile | 3-Miles | 5-Miles | ||
---|---|---|---|---|
Total Population | 5,517 | 60,346 | 96,893 | |
Population Median Age | 40 | 36 | 37 | |
Population by Age | 0-9 Yrs | 531 (9%) | 7113 (11%) | 11723 (12%) |
10-19 Yrs | 802 (14%) | 8666 (14%) | 13710 (14%) | |
20-29 Yrs | 968 (17%) | 14707 (24%) | 20394 (21%) | |
30-39 Yrs | 497 (9%) | 6940 (11%) | 10696 (11%) | |
40-49 Yrs | 608 (11%) | 5846 (9%) | 9834 (10%) | |
50-59 Yrs | 655 (11%) | 5602 (9%) | 9717 (10%) | |
60-69 Yrs | 650 (11%) | 5774 (9%) | 9802 (10%) | |
70+ Yrs | 806 (14%) | 5699 (9%) | 11017 (11%) | |
Median HH Income | $29,920 | $32,424 | $39,515 | |
Total Household Income | < 24K | 972 (40%) | 9583 (40%) | 12513 (33%) |
25-49K | 723 (30%) | 6190 (26%) | 9650 (25%) | |
50-74K | 342 (14%) | 3843 (16%) | 6262 (16%) | |
75-99K | 113 (4%) | 1833 (7%) | 3688 (9%) | |
100-199K | 197 (8%) | 1828 (7%) | 4524 (11%) | |
200K+ | 37 (1%) | 387 (1%) | 1086 (2%) | |
Highest Education Level | No Diploma | 713 | 6272 | 8639 |
Diploma or GED | 917 | 8495 | 12858 | |
Some College | 886 | 8362 | 13881 | |
Assoc. Degree | 283 | 2831 | 4643 | |
Bachelors Degree | 529 | 5458 | 10830 | |
Higher Degree | 317 | 3461 | 7461 | |
Total Housing Units | 2,603 | 27,090 | 42,792 | |
--Owner-Occupied | 1,112 | 10,728 | 19,599 | |
--Renter-Occupied | 1,272 | 12,935 | 18,124 | |
Owner-Occupied Values | < 100K | 451 | 3763 | 5047 |
100-199K | 409 | 5129 | 8743 | |
200-299K | 114 | 1075 | 3472 | |
300-399K | 102 | 378 | 1172 | |
400-499K | 14 | 163 | 630 | |
500K+ | 22 | 221 | 534 | |
Total Working Age Population | 4,528 | 49,222 | 78,517 | |
In Work Force | 2,447 | 29,178 | 46,026 | |
Not In Work Force | 2,081 | 20,043 | 32,491 | |
Workforce Employed | 2,221 | 26,442 | 42,210 | |
Workforce Unemployed | 227 | 2,666 | 3,630 | |
Civlian Workforce | 2,447 | 29,108 | 45,840 | |
Military Workforce | 0 | 70 | 185 | |
Total Households | 2,384 | 23,663 | 37,723 | |
Family Households | 1,311 | 13,292 | 22,772 | |
Non-Family Households | 1,072 | 10,371 | 14,951 | |
Married Couple | 702 | 7,213 | 14,576 | |
Other Family | 610 | 6,079 | 8,196 | |
Married w/Child | 210 | 2,700 | 5,332 | |
Single Male w/Child | 6 | 660 | 787 | |
Single Female w/Child | 296 | 2,470 | 3,499 |
Population Change Last Two Decades - Plus Projection
2000 | % | 2010 | % | 2020 | % | 2030 | |
---|---|---|---|---|---|---|---|
New Mexico | 1,819,046 | +13 | 2,059,179 | +6 | 2,187,183 | +6 | 2,308,475 |
Doña Ana County | 174,682 | +20 | 209,233 | +11 | 232,946 | +9 | 255,070 |
Total Working Age Population:
Total Households:
Total Working Age Population:
Total Households:
Total Working Age Population:
Total Households: