Flex-Office-Warehouse
526 Cleveland Street West Coopersville, MI 49404
526 Cleveland Street West Coopersville, MI 49404

Details & Description
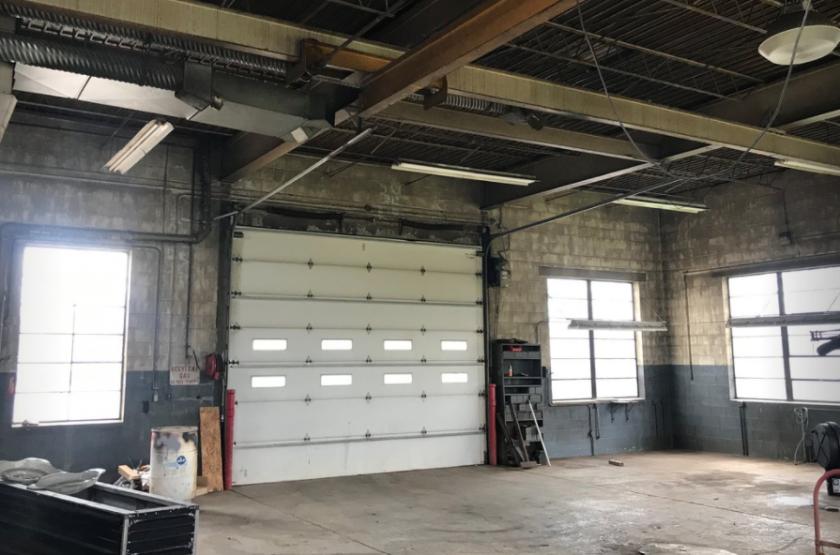
Additional Photos


Listing Agents

Kurt Kunst
O: 616-242-1116
M: 616-292-1720
kurtk@naiwwm.com
O: 616-242-1116
M: 616-292-1720
kurtk@naiwwm.com
While we strive to provide the most accurate information, all listing information, and demographic data, is provided by third-parties. As such, MyEListing will not be responsible for the accuracy of the information. It is strongly recommended that you verify all information with the listing agent, and any relevant agencies, prior to making any decisions.


