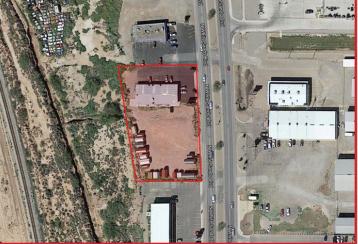
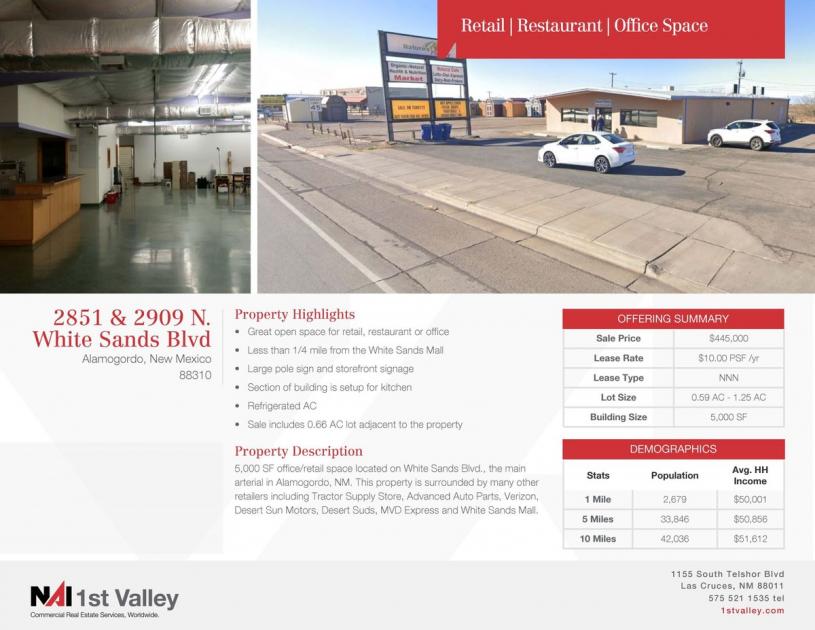
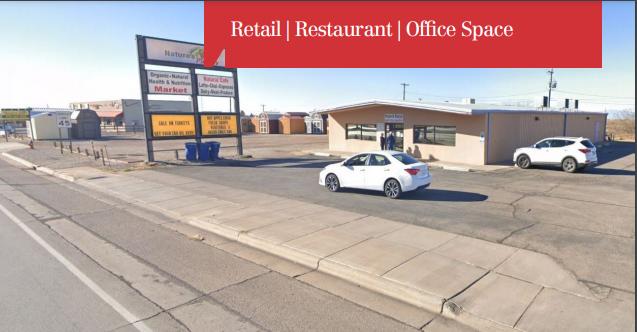
1-Mile | 3-Miles | 5-Miles | ||
---|---|---|---|---|
Total Population | 3,059 | 22,164 | 31,535 | |
Population Median Age | 37 | 41 | 40 | |
Population by Age | 0-9 Yrs | 528 (17%) | 2714 (12%) | 3855 (12%) |
10-19 Yrs | 410 (13%) | 2485 (11%) | 3607 (11%) | |
20-29 Yrs | 324 (10%) | 3031 (13%) | 4779 (15%) | |
30-39 Yrs | 421 (13%) | 2846 (12%) | 3972 (12%) | |
40-49 Yrs | 263 (8%) | 2325 (10%) | 3323 (10%) | |
50-59 Yrs | 455 (14%) | 2944 (13%) | 4112 (13%) | |
60-69 Yrs | 348 (11%) | 2814 (12%) | 3733 (11%) | |
70+ Yrs | 309 (10%) | 3005 (13%) | 4153 (13%) | |
Median HH Income | $43,917 | $40,292 | $41,740 | |
Total Household Income | < 24K | 360 (33%) | 2853 (31%) | 3567 (27%) |
25-49K | 241 (22%) | 2600 (28%) | 3850 (29%) | |
50-74K | 215 (19%) | 1524 (16%) | 2256 (17%) | |
75-99K | 104 (9%) | 991 (10%) | 1347 (10%) | |
100-199K | 152 (14%) | 1112 (12%) | 1679 (13%) | |
200K+ | 13 (1%) | 95 (1%) | 158 (1%) | |
Highest Education Level | No Diploma | 199 | 1732 | 2621 |
Diploma or GED | 545 | 4477 | 6225 | |
Some College | 654 | 4590 | 6138 | |
Assoc. Degree | 262 | 1864 | 2541 | |
Bachelors Degree | 241 | 1738 | 2474 | |
Higher Degree | 84 | 965 | 1576 | |
Total Housing Units | 1,356 | 10,807 | 15,266 | |
--Owner-Occupied | 720 | 5,663 | 7,912 | |
--Renter-Occupied | 365 | 3,513 | 4,946 | |
Owner-Occupied Values | < 100K | 307 | 2420 | 3270 |
100-199K | 314 | 2532 | 3281 | |
200-299K | 82 | 591 | 1022 | |
300-399K | 16 | 106 | 236 | |
400-499K | 0 | 2 | 38 | |
500K+ | 0 | 11 | 66 | |
Total Working Age Population | 2,255 | 17,975 | 25,486 | |
In Work Force | 1,170 | 10,242 | 14,833 | |
Not In Work Force | 1,085 | 7,733 | 10,653 | |
Workforce Employed | 970 | 8,873 | 12,878 | |
Workforce Unemployed | 158 | 756 | 934 | |
Civlian Workforce | 1,128 | 9,629 | 13,812 | |
Military Workforce | 42 | 614 | 1,020 | |
Total Households | 1,085 | 9,176 | 12,858 | |
Family Households | 624 | 4,933 | 7,252 | |
Non-Family Households | 461 | 4,243 | 5,606 | |
Married Couple | 502 | 3,607 | 5,288 | |
Other Family | 122 | 1,326 | 1,963 | |
Married w/Child | 231 | 1,232 | 1,822 | |
Single Male w/Child | 5 | 152 | 244 | |
Single Female w/Child | 85 | 535 | 822 |
Population Change Last Two Decades - Plus Projection
2000 | % | 2010 | % | 2020 | % | 2030 | |
---|---|---|---|---|---|---|---|
New Mexico | 1,819,046 | +13 | 2,059,179 | +6 | 2,187,183 | +6 | 2,308,475 |
Otero County | 62,298 | +2 | 63,797 | +3 | 65,884 | -1 | 65,304 |
Total Working Age Population:
Total Households:
Total Working Age Population:
Total Households:
Total Working Age Population:
Total Households: