Specialty Real Estate
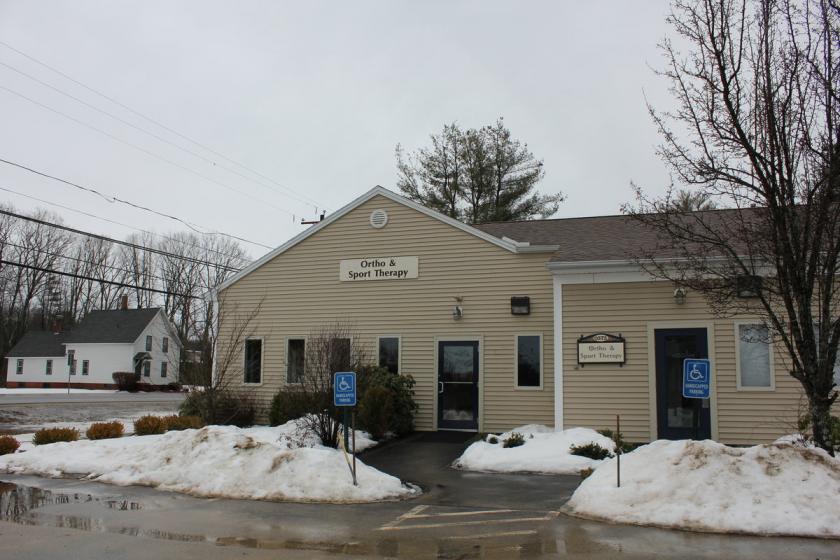
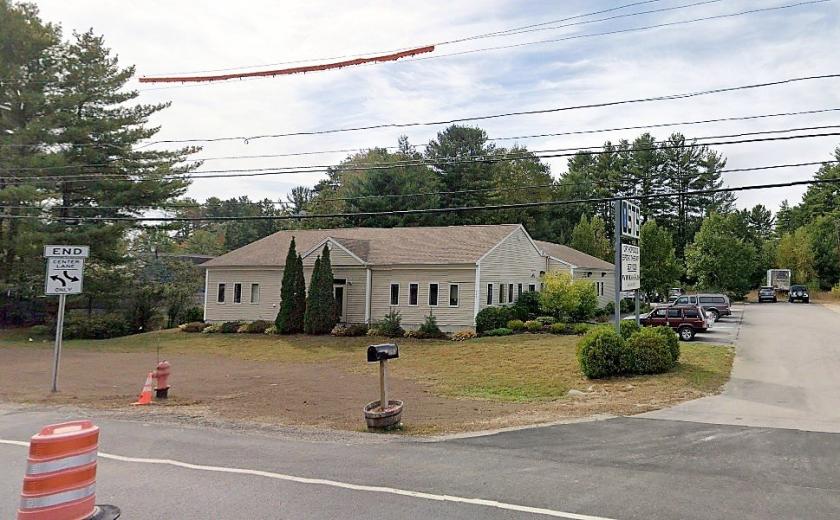
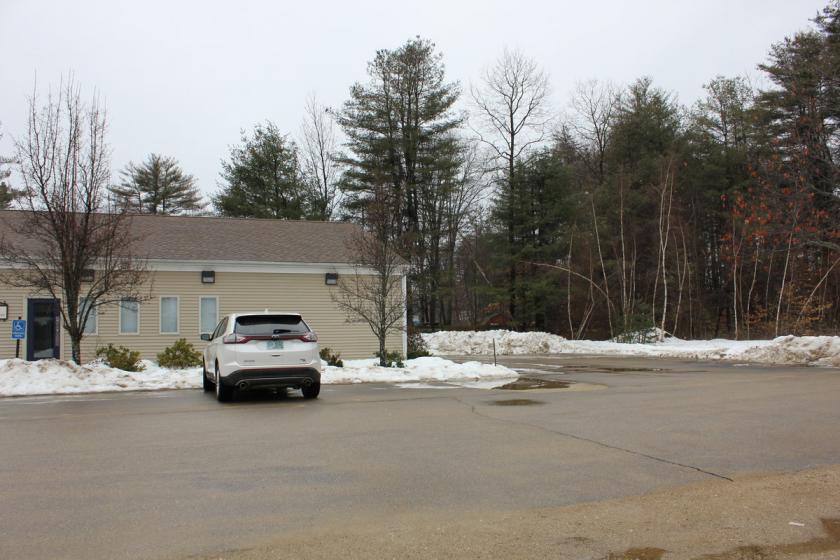
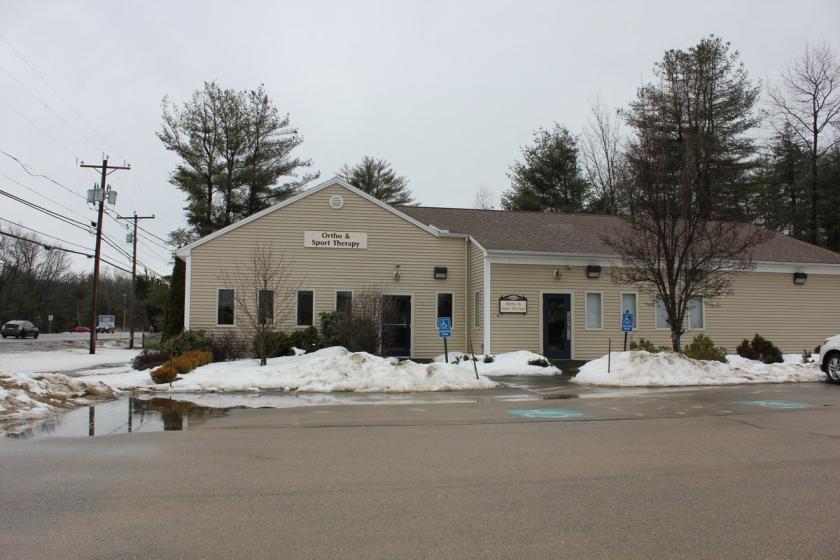
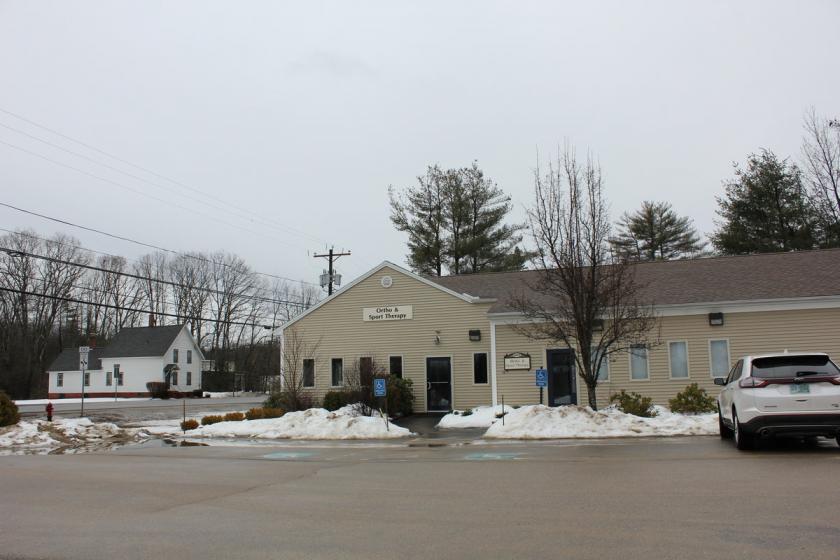
393 Gonic Road Rochester, NH 03839
393 Gonic Road Rochester, NH 03839
Details & Description
Additional Photos

Listing Agents

Deana Arden
O: 603-431-3001
M: 603-682-3440
darden@nainorwoodgroup.com
O: 603-431-3001
M: 603-682-3440
darden@nainorwoodgroup.com
While we strive to provide the most accurate information, all listing information, and demographic data, is provided by third-parties. As such, MyEListing will not be responsible for the accuracy of the information. It is strongly recommended that you verify all information with the listing agent, and any relevant agencies, prior to making any decisions.