Industrial Properties
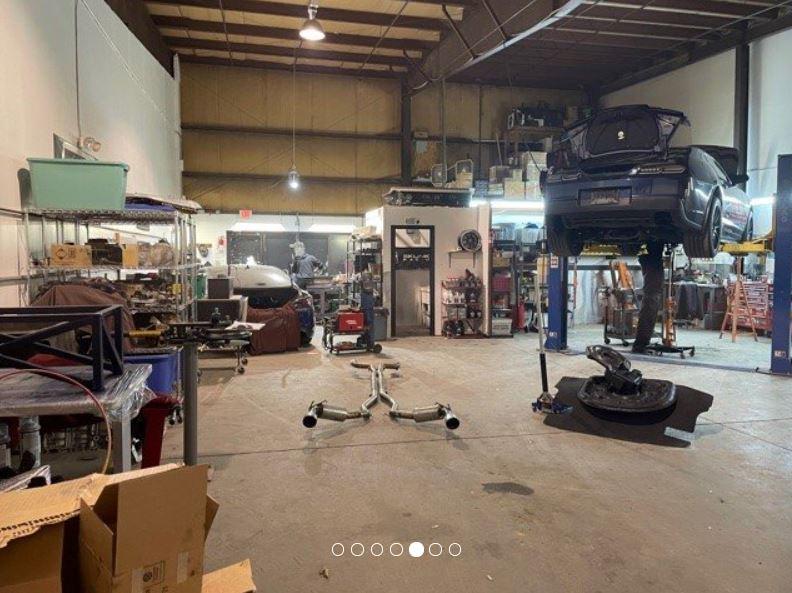
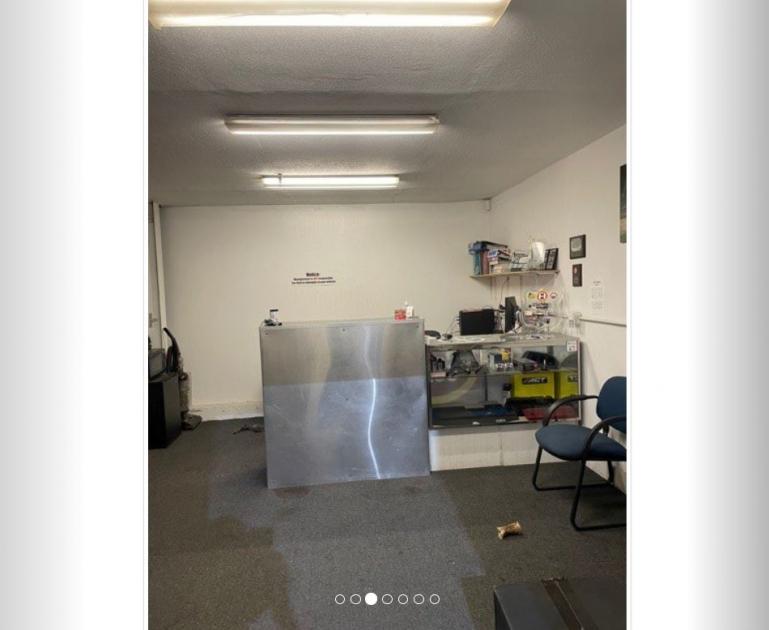
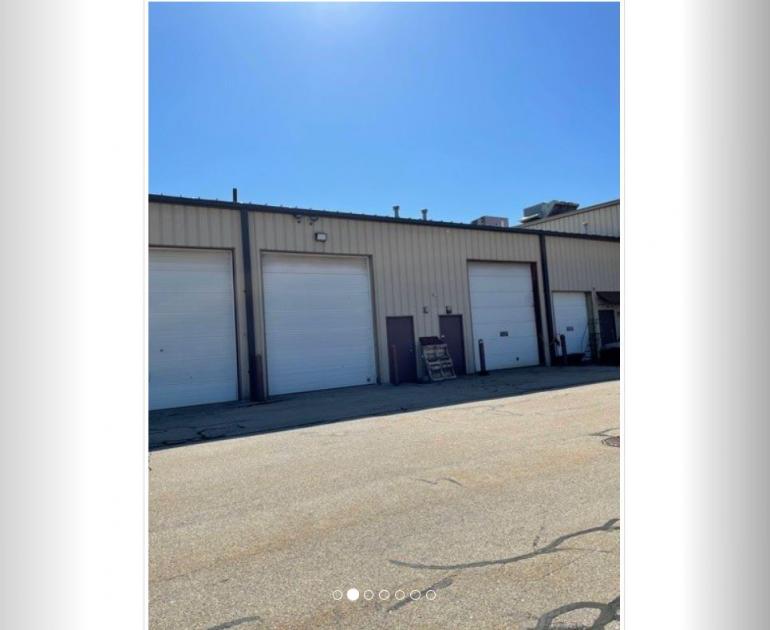
100 Carl Drive Manchester, NH 03103
100 Carl Drive Manchester, NH 03103
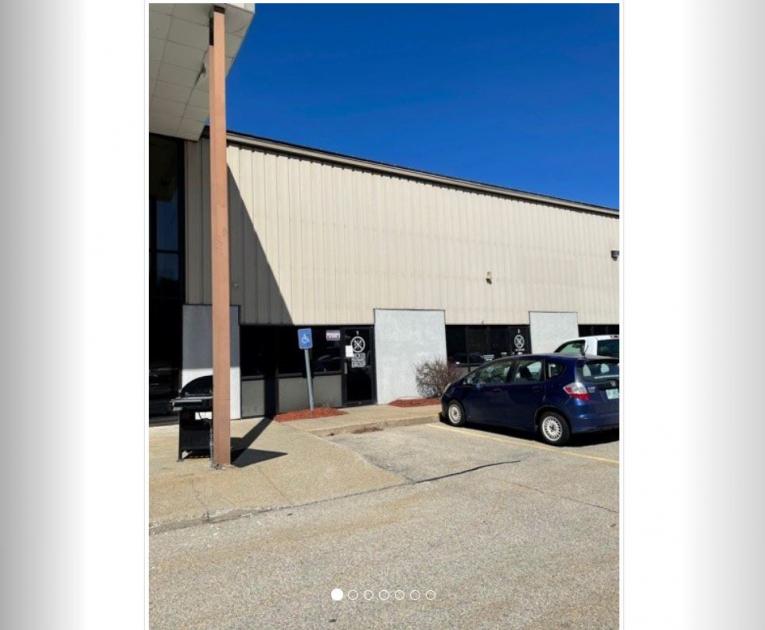
Details & Description
Additional Photos

Listing Agents

Aron Brown
O: 603-668-7000
M: 603-674-1638
abrown@nainorwoodgroup.com
O: 603-668-7000
M: 603-674-1638
abrown@nainorwoodgroup.com
While we strive to provide the most accurate information, all listing information, and demographic data, is provided by third-parties. As such, MyEListing will not be responsible for the accuracy of the information. It is strongly recommended that you verify all information with the listing agent, and any relevant agencies, prior to making any decisions.


