Industrial Properties
1415 Trae Lane Lithia Springs, GA 30122
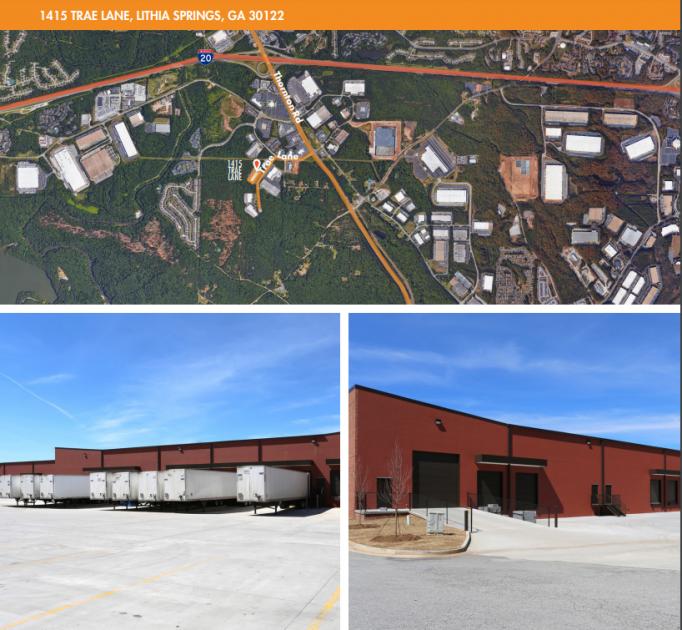
1415 Trae Lane Lithia Springs, GA 30122

Details & Description
Listing Agents

Ryan Blackburn
O: 404-974-2716
M: 404-821-7715
rblackburn@apexindustrialre.com
O: 404-974-2716
M: 404-821-7715
rblackburn@apexindustrialre.com
While we strive to provide the most accurate information, all listing information, and demographic data, is provided by third-parties. As such, MyEListing will not be responsible for the accuracy of the information. It is strongly recommended that you verify all information with the listing agent, and any relevant agencies, prior to making any decisions.