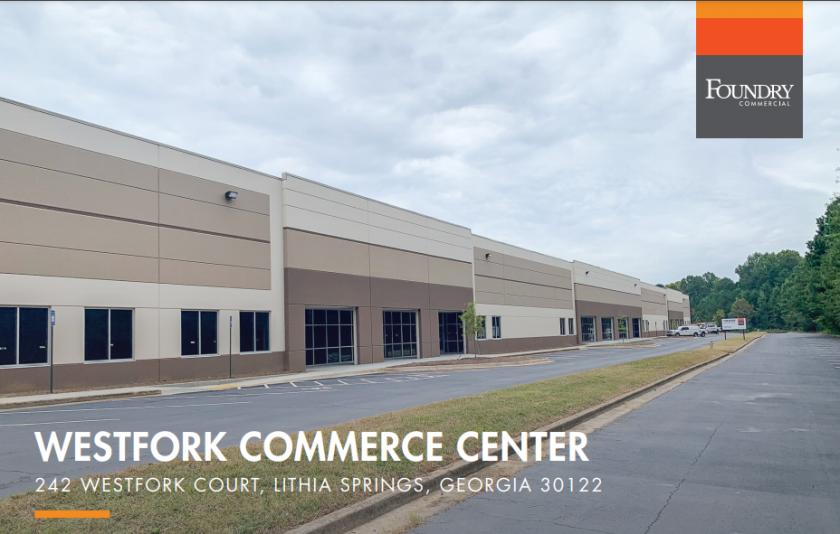
Westfork Commerce Center is located in Lithia Springs, Georgia off Thornton Road. The state of the art industrial facility gives local, regional and national users quick access to Metro Atlanta and the Southeast. It is approximately 2.2 miles from Interstate 20 and 7.4 miles from Interstate 285. Conveniently 2.8 miles from the Austell Norfolk Southern Intermodal Terminal, this infill distribution facility is ideally located for all types of users.
BUILDING FEATURES:
86,400 SF building size
2,000 SF Office
33 (9' x 10') docks
24' clear height
ESFR sprinkler
Expected delivery August 1st, 2020
1.0/1,000 SF parking ratio
54' x 50' column spacing
LED lighting
DRIVING DISTANCES
2.9 miles from Norfolk Southern Intermodal Terminal
2.1 miles from I-20
8.6 miles from I-285
21.8 miles from Hartsfield Jackson International Airport
8.0 miles from UPS Charlie Brown
3.7 miles from FedEx Factory Shoals
15.6 miles from Downtown Atlanta
No part of this information may be copied, reproduced, repurposed, or screen-captured for any commercial purpose without prior written authorization from MyEListing.
While we strive to provide the most accurate information, all listing information, and demographic data, is provided by third-parties. As such, MyEListing will not be responsible for the accuracy of the information. It is strongly recommended that you verify all information with the listing agent, and any relevant agencies, prior to making any decisions.
What is the building size of this commercial Industrial property?
The size of this lease property at '.242 Westfork Boulevard.' is 20000 square feet
What is the population within 1 mile of 242 Westfork Boulevard in Lithia Springs?
The population within 1 mile of 242 Westfork Boulevard Lithia Springs, GA 30122 is 5,683 people.
Who do I contact for questions about 242 Westfork Boulevard?
You should contact the listing agent,
Ryan Blackburn, for any details regarding this commercial listing.