Office Space
1248 O Street Lincoln, NE 68508
1248 O Street Lincoln, NE 68508

Details & Description
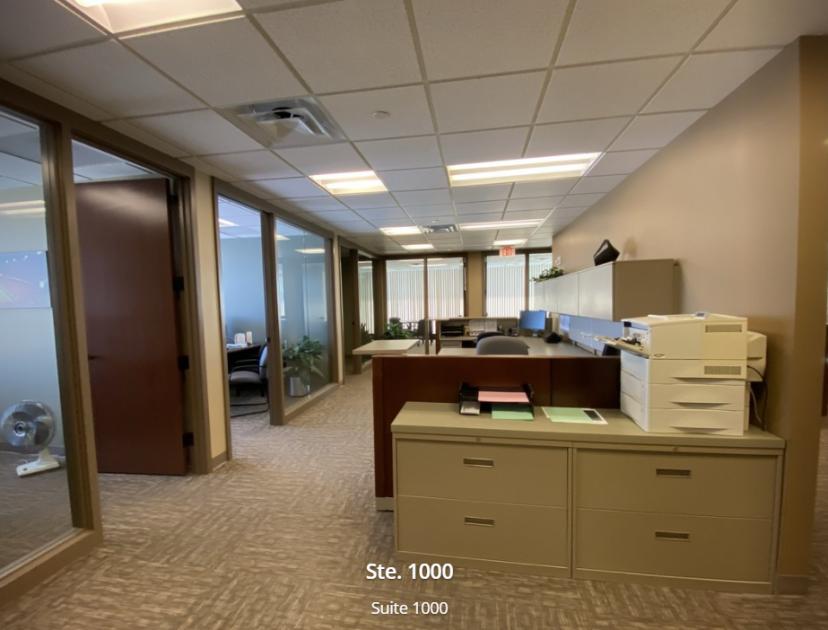
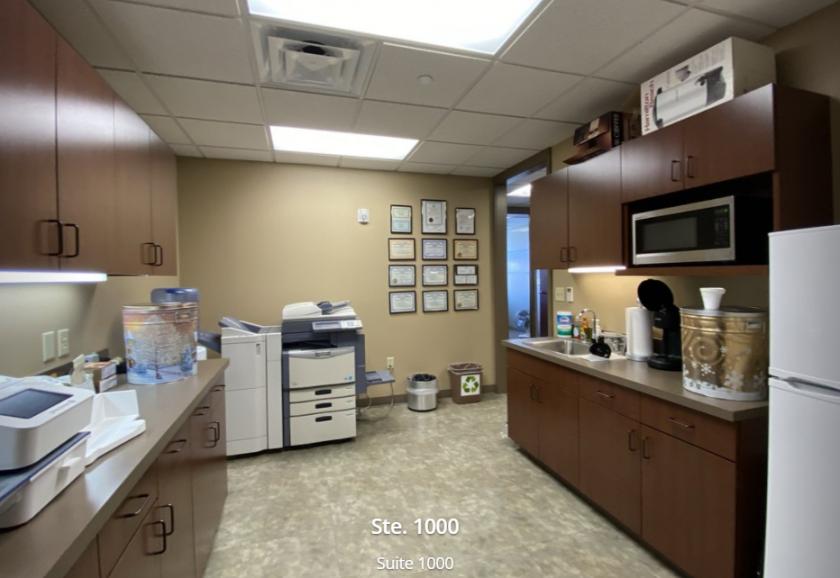
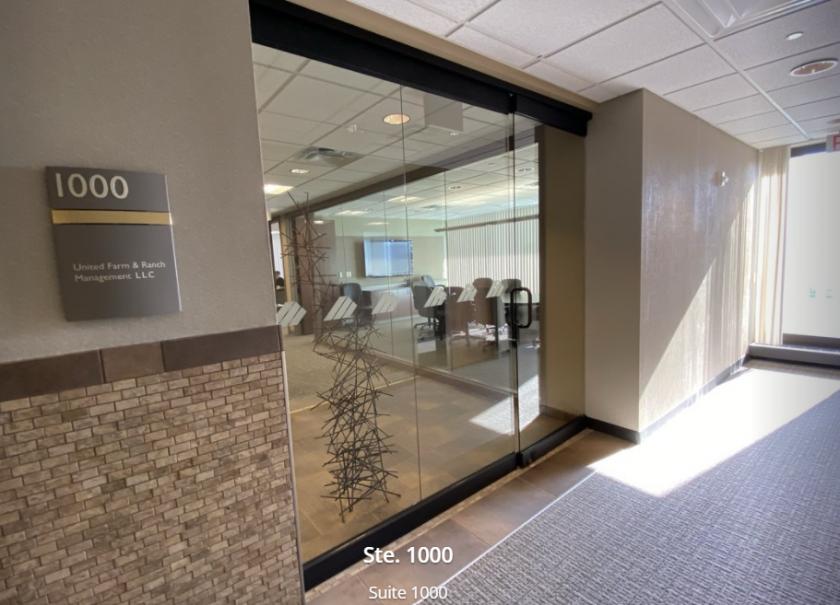
Additional Photos

Listing Agents

Thomas Graf
O: 402-441-5800
M: 402-202-7725
tgraf@naifma.com
O: 402-441-5800
M: 402-202-7725
tgraf@naifma.com
While we strive to provide the most accurate information, all listing information, and demographic data, is provided by third-parties. As such, MyEListing will not be responsible for the accuracy of the information. It is strongly recommended that you verify all information with the listing agent, and any relevant agencies, prior to making any decisions.


