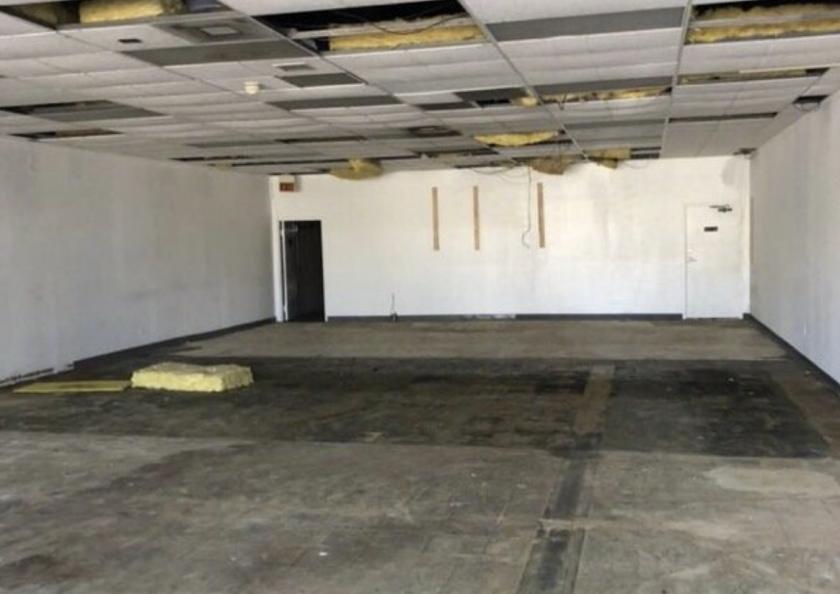
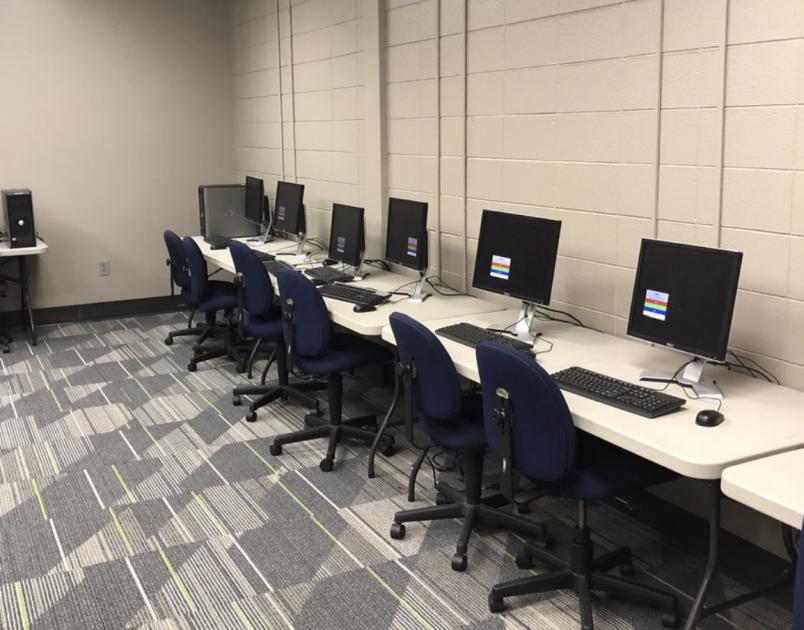
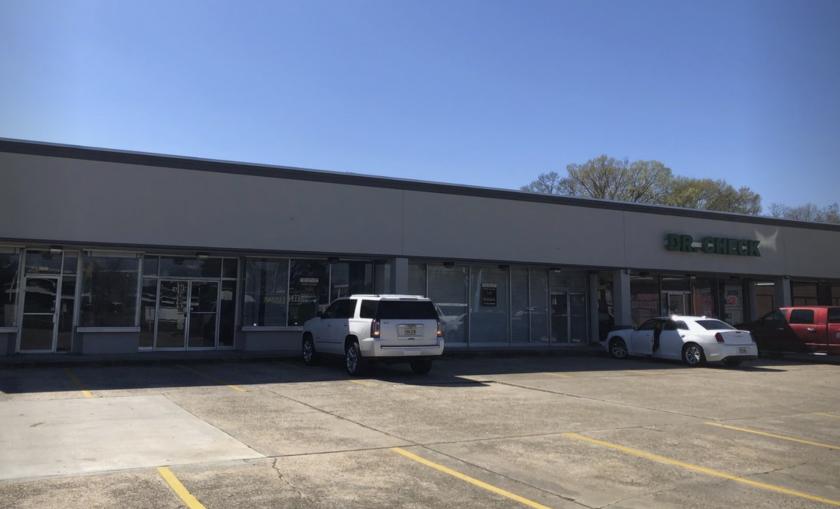
1-Mile | 3-Miles | 5-Miles | ||
---|---|---|---|---|
Total Population | 10,347 | 81,063 | 206,668 | |
Population Median Age | 35 | 38 | 36 | |
Population by Age | 0-9 Yrs | 1916 (18%) | 10308 (12%) | 27249 (13%) |
10-19 Yrs | 1105 (10%) | 9562 (11%) | 27868 (13%) | |
20-29 Yrs | 1550 (14%) | 13805 (17%) | 39786 (19%) | |
30-39 Yrs | 1782 (17%) | 11892 (14%) | 27421 (13%) | |
40-49 Yrs | 1047 (10%) | 9087 (11%) | 20508 (9%) | |
50-59 Yrs | 1027 (9%) | 9514 (11%) | 22722 (10%) | |
60-69 Yrs | 969 (9%) | 9249 (11%) | 22144 (10%) | |
70+ Yrs | 952 (9%) | 7646 (9%) | 18970 (9%) | |
Median HH Income | $33,431 | $43,088 | $45,064 | |
Total Household Income | < 24K | 1721 (39%) | 10598 (32%) | 23871 (30%) |
25-49K | 991 (22%) | 7477 (23%) | 18554 (23%) | |
50-74K | 477 (10%) | 4440 (13%) | 12597 (16%) | |
75-99K | 350 (7%) | 3098 (9%) | 7283 (9%) | |
100-199K | 692 (15%) | 4830 (14%) | 11953 (15%) | |
200K+ | 160 (3%) | 1918 (5%) | 4171 (5%) | |
Highest Education Level | No Diploma | 1048 | 7065 | 15666 |
Diploma or GED | 1718 | 14731 | 35639 | |
Some College | 1643 | 11678 | 29290 | |
Assoc. Degree | 330 | 2170 | 5876 | |
Bachelors Degree | 1146 | 10988 | 25058 | |
Higher Degree | 813 | 7044 | 16793 | |
Total Housing Units | 5,151 | 38,630 | 94,799 | |
--Owner-Occupied | 1,404 | 16,236 | 39,036 | |
--Renter-Occupied | 2,988 | 16,125 | 39,393 | |
Owner-Occupied Values | < 100K | 210 | 4737 | 9624 |
100-199K | 507 | 4425 | 13528 | |
200-299K | 281 | 2884 | 8235 | |
300-399K | 110 | 1619 | 2994 | |
400-499K | 104 | 830 | 1516 | |
500K+ | 192 | 1742 | 3140 | |
Total Working Age Population | 7,786 | 65,191 | 165,864 | |
In Work Force | 5,088 | 42,466 | 107,223 | |
Not In Work Force | 2,698 | 22,725 | 58,641 | |
Workforce Employed | 4,606 | 38,697 | 97,914 | |
Workforce Unemployed | 481 | 3,757 | 9,248 | |
Civlian Workforce | 5,087 | 42,454 | 107,163 | |
Military Workforce | 1 | 12 | 60 | |
Total Households | 4,392 | 32,361 | 78,429 | |
Family Households | 2,142 | 17,232 | 41,692 | |
Non-Family Households | 2,250 | 15,129 | 36,737 | |
Married Couple | 1,033 | 9,258 | 23,458 | |
Other Family | 1,110 | 7,973 | 18,235 | |
Married w/Child | 390 | 3,156 | 7,816 | |
Single Male w/Child | 98 | 485 | 1,379 | |
Single Female w/Child | 674 | 3,353 | 7,402 |
Population Change Last Two Decades - Plus Projection
2000 | % | 2010 | % | 2020 | % | 2030 | |
---|---|---|---|---|---|---|---|
Louisiana | 4,468,976 | +1 | 4,533,372 | +1 | 4,588,310 | +5 | 4,813,420 |
East Baton Rouge Parish | 412,852 | +7 | 440,171 | -3 | 426,380 | -1 | 421,500 |
Iberville Parish | 33,320 | 0 | 33,387 | -17 | 27,830 | -11 | 24,640 |
St. Martin Parish | 48,583 | +7 | 52,160 | +6 | 55,520 | +3 | 57,000 |
West Baton Rouge Parish | 21,601 | +10 | 23,788 | -7 | 22,220 | -5 | 21,070 |
Total Working Age Population:
Total Households:
Total Working Age Population:
Total Households:
Total Working Age Population:
Total Households: