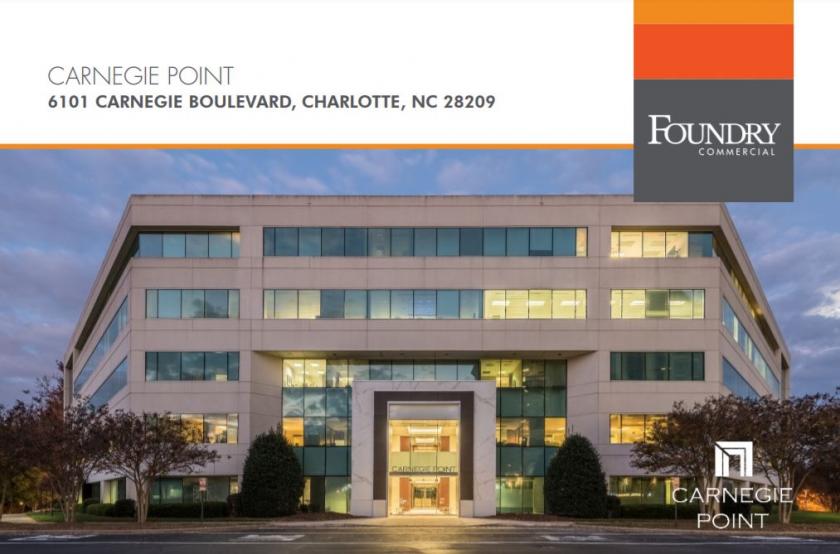
Building renovations recently completed
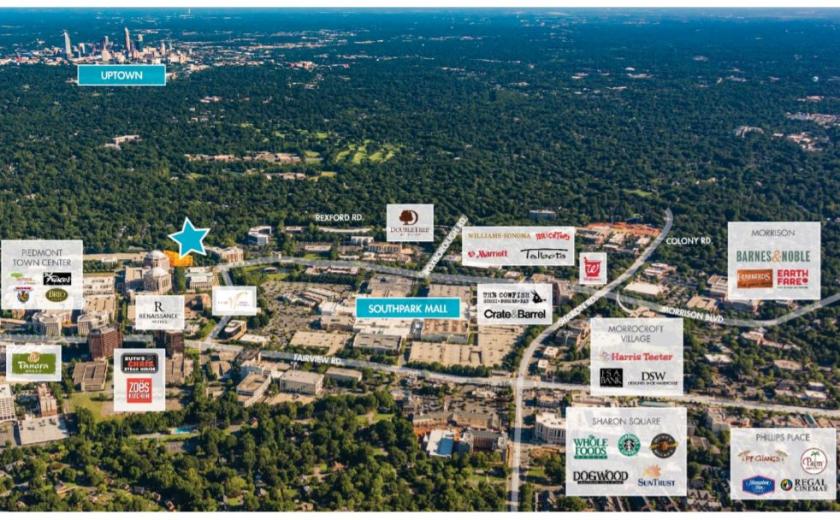
Convenient SouthPark location with close proximity to dining, retail, and entertainment
Both surface and structured parking deck available
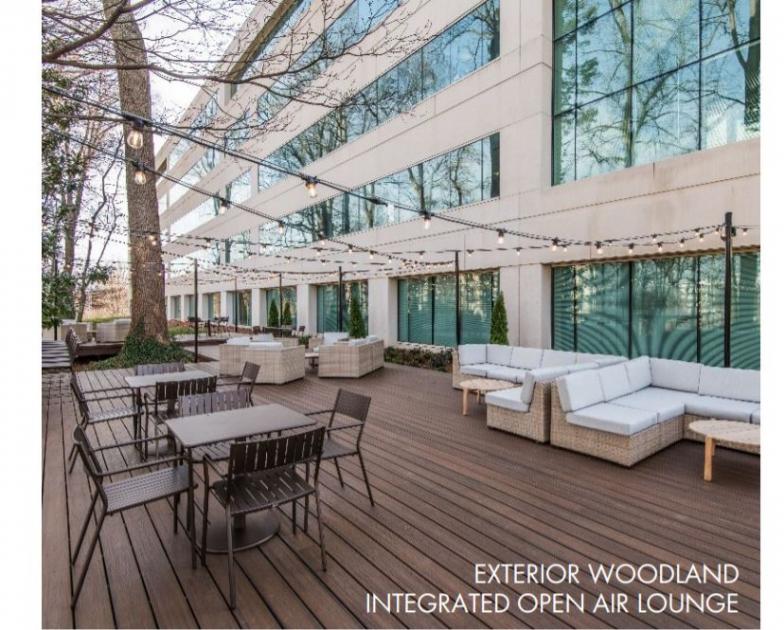
Abundant natural light with extensive glass lines
Fifteen minutes to Charlotte-Douglas International Airport
Availabilities:
Suite 200 - 3,763 - 15,089 RSF (Available 5/1/21)
Suite 340 - 2,178 RSF
Suite 425 - 2,651 RSF
Suite 430 - 2,977 RSF
Suites 425 & 430 are contiguous for 5,628 RSF
Suite 520 - 7,204 RSF (Available 1/1/22)
Suite 550 - 1,837 RSF (Sublease)
Suite 520 & 550 are contiguous for 9,041 RSF
No part of this information may be copied, reproduced, repurposed, or screen-captured for any commercial purpose without prior written authorization from MyEListing.
While we strive to provide the most accurate information, all listing information, and demographic data, is provided by third-parties. As such, MyEListing will not be responsible for the accuracy of the information. It is strongly recommended that you verify all information with the listing agent, and any relevant agencies, prior to making any decisions.
What is the asking price for 6101 Carnegie Boulevard in Charlotte?
The asking price for 6101 Carnegie Boulevard is $33.00 a SF per Year
What is the building size of this commercial Office property?
The size of this multi-unit property varies between 2178 - 15089 square feet
What kind of Office is the propery at 6101 Carnegie Boulevard?
The property at 6101 Carnegie Boulevard Charlotte, NC 28209 is listed as a Professional Office property
What is the population within 1 mile of 6101 Carnegie Boulevard in Charlotte?
The population within 1 mile of 6101 Carnegie Boulevard Charlotte, NC 28209 is 8,876 people.
Who do I contact for questions about 6101 Carnegie Boulevard?
You should contact the listing agent,
Meredith Ball, for any details regarding this commercial listing.