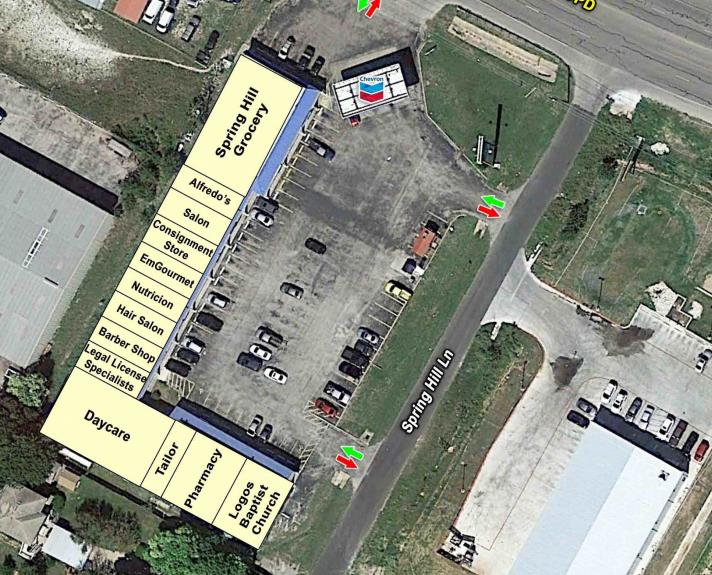
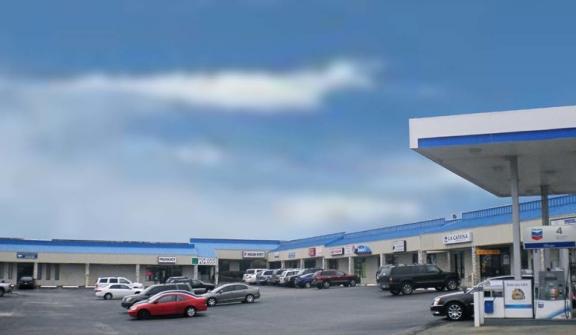
1-Mile | 3-Miles | 5-Miles | ||
---|---|---|---|---|
Total Population | 11,853 | 100,219 | 231,465 | |
Population Median Age | 36 | 35 | 35 | |
Population by Age | 0-9 Yrs | 1625 (13%) | 13499 (13%) | 31337 (13%) |
10-19 Yrs | 1552 (13%) | 12595 (12%) | 28019 (12%) | |
20-29 Yrs | 1534 (12%) | 14716 (14%) | 35064 (15%) | |
30-39 Yrs | 2114 (17%) | 19193 (19%) | 44230 (19%) | |
40-49 Yrs | 1662 (14%) | 14019 (13%) | 34284 (14%) | |
50-59 Yrs | 1689 (14%) | 12290 (12%) | 27158 (11%) | |
60-69 Yrs | 975 (8%) | 8971 (8%) | 20170 (8%) | |
70+ Yrs | 702 (5%) | 4935 (4%) | 11204 (4%) | |
Median HH Income | $68,824 | $73,920 | $74,773 | |
Total Household Income | < 24K | 672 (15%) | 4180 (10%) | 8854 (10%) |
25-49K | 833 (19%) | 7904 (20%) | 17172 (19%) | |
50-74K | 866 (19%) | 7262 (19%) | 17224 (19%) | |
75-99K | 735 (16%) | 6203 (16%) | 13803 (16%) | |
100-199K | 1014 (23%) | 10616 (27%) | 24175 (28%) | |
200K+ | 223 (5%) | 1998 (5%) | 5003 (5%) | |
Highest Education Level | No Diploma | 1144 | 6220 | 13222 |
Diploma or GED | 2187 | 15381 | 32974 | |
Some College | 1965 | 15088 | 34405 | |
Assoc. Degree | 476 | 5230 | 13442 | |
Bachelors Degree | 1847 | 19338 | 45633 | |
Higher Degree | 700 | 7970 | 19662 | |
Total Housing Units | 4,601 | 40,522 | 92,048 | |
--Owner-Occupied | 2,572 | 20,794 | 46,507 | |
--Renter-Occupied | 1,770 | 17,370 | 39,725 | |
Owner-Occupied Values | < 100K | 301 | 1322 | 3041 |
100-199K | 1252 | 6478 | 13294 | |
200-299K | 892 | 9781 | 20221 | |
300-399K | 100 | 2799 | 7781 | |
400-499K | 2 | 172 | 1386 | |
500K+ | 25 | 242 | 784 | |
Total Working Age Population | 9,150 | 79,219 | 183,255 | |
In Work Force | 6,858 | 59,400 | 138,524 | |
Not In Work Force | 2,292 | 19,819 | 44,731 | |
Workforce Employed | 6,482 | 56,648 | 132,478 | |
Workforce Unemployed | 358 | 2,623 | 5,827 | |
Civlian Workforce | 6,840 | 59,270 | 138,305 | |
Military Workforce | 18 | 130 | 220 | |
Total Households | 4,342 | 38,164 | 86,232 | |
Family Households | 2,929 | 24,225 | 54,336 | |
Non-Family Households | 1,413 | 13,938 | 31,896 | |
Married Couple | 2,196 | 17,682 | 40,043 | |
Other Family | 734 | 6,543 | 14,293 | |
Married w/Child | 1,040 | 7,999 | 18,434 | |
Single Male w/Child | 143 | 1,223 | 2,358 | |
Single Female w/Child | 249 | 2,325 | 5,342 |
Population Change Last Two Decades - Plus Projection
2000 | % | 2010 | % | 2020 | % | 2030 | |
---|---|---|---|---|---|---|---|
Texas | 20,851,820 | +21 | 25,145,561 | +18 | 29,677,668 | +18 | 34,894,452 |
Bastrop County | 57,733 | +28 | 74,171 | +16 | 86,105 | +15 | 99,211 |
Travis County | 812,280 | +26 | 1,024,266 | +26 | 1,291,502 | +19 | 1,540,812 |
Williamson County | 249,967 | +69 | 422,679 | +40 | 589,914 | +41 | 830,421 |
Total Working Age Population:
Total Households:
Total Working Age Population:
Total Households:
Total Working Age Population:
Total Households: