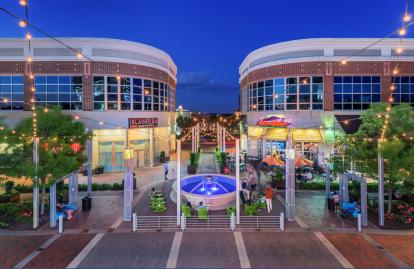
Located in the heart of Ballantyne on the corner of Highway 521/Johnston Road and Ballantyne Commons Parkway, Ballantyne Village is a thriving center full of interesting and exciting activities, which makes the center come alive day and night. Patrons enjoy a relaxed enviornment that is convenient to their work and family life.
Property Highlights:
1,019 - 4,791 SF available
Across from the second largest corporate office park in Charlotte
55,000 VPD on Highway 521 (Johnston Rd.) at Ballantyne Commons Parkway
Plentiful parking with surface lots and a covered parking deck
The dining hub of South Charlotte with more than 30 restaurants located at Ballantyne's main intersection
11 area hotels
Site of the new 14-story office tower and hotel expected to be complete is 2021 which will feature 100,000 SF of office space, a 186-room AC Marriott hotel, a rooftop restaurant and 400 additional parking spaces
No part of this information may be copied, reproduced, repurposed, or screen-captured for any commercial purpose without prior written authorization from MyEListing.
While we strive to provide the most accurate information, all listing information, and demographic data, is provided by third-parties. As such, MyEListing will not be responsible for the accuracy of the information. It is strongly recommended that you verify all information with the listing agent, and any relevant agencies, prior to making any decisions.
What is the building size of this commercial Retail property?
The size of this multi-unit property varies between 1019 - 4791 square feet
What kind of Retail is the propery at 14825 Ballantyne Village Way?
The property at 14825 Ballantyne Village Way Charlotte, NC 28277 is listed as a Shopping Center Retail property
What is the population within 1 mile of 14825 Ballantyne Village Way in Charlotte?
The population within 1 mile of 14825 Ballantyne Village Way Charlotte, NC 28277 is 10,014 people.
Who do I contact for questions about 14825 Ballantyne Village Way?
You should contact the listing agent,
Keely Hines , for any details regarding this commercial listing.