Industrial Properties
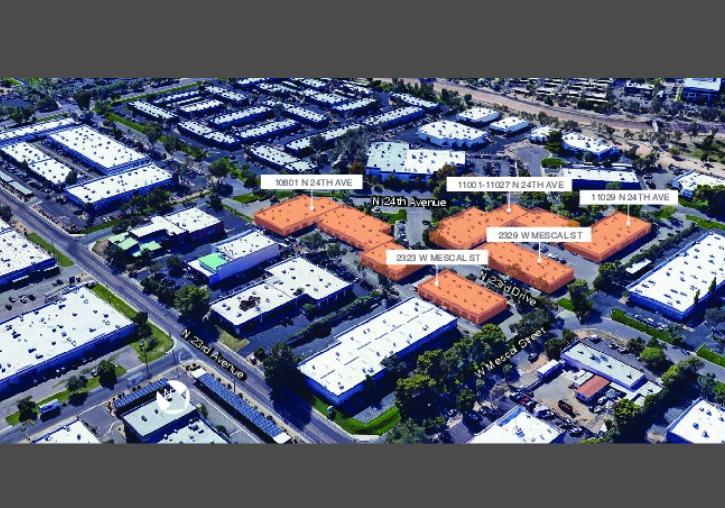
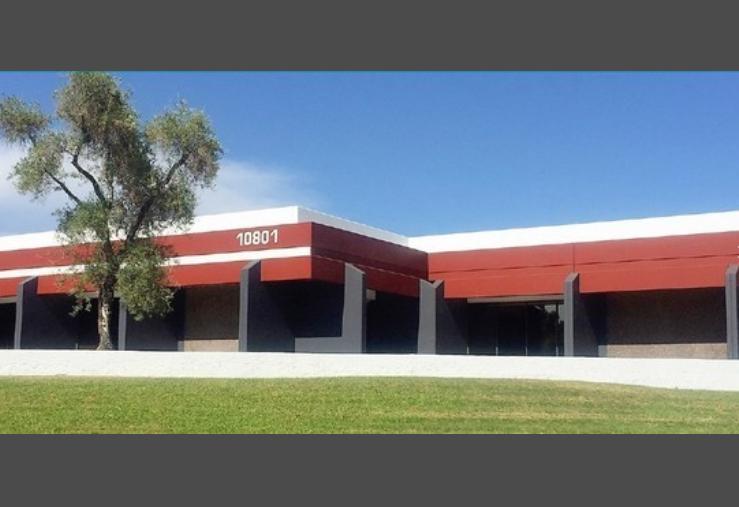
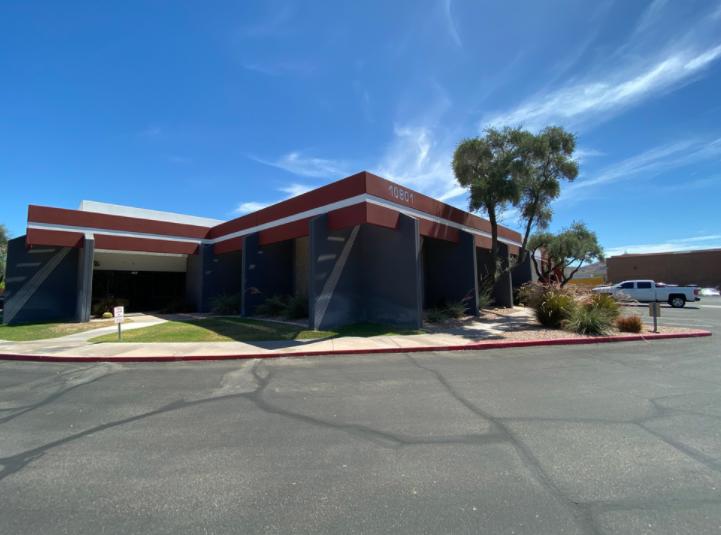
10801 North 24th Avenue Phoenix, AZ 85029
10801 North 24th Avenue Phoenix, AZ 85029
Details & Description
Listing Agents

Gregg Kafka
O: 602-954-3777
M: 480-225-4867
gkafka@leearizona.com
O: 602-954-3777
M: 480-225-4867
gkafka@leearizona.com
While we strive to provide the most accurate information, all listing information, and demographic data, is provided by third-parties. As such, MyEListing will not be responsible for the accuracy of the information. It is strongly recommended that you verify all information with the listing agent, and any relevant agencies, prior to making any decisions.