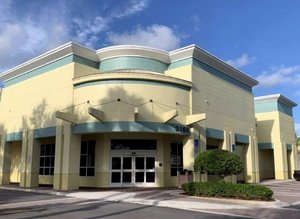
1-Mile | 3-Miles | 5-Miles | ||
---|---|---|---|---|
Total Population | 37,757 | 281,093 | 617,471 | |
Population Median Age | 44 | 43 | 42 | |
Population by Age | 0-9 Yrs | 3584 (9%) | 27859 (9%) | 64597 (10%) |
10-19 Yrs | 2779 (7%) | 26818 (9%) | 55316 (8%) | |
20-29 Yrs | 4419 (11%) | 33159 (11%) | 77547 (12%) | |
30-39 Yrs | 5408 (14%) | 38080 (13%) | 97469 (15%) | |
40-49 Yrs | 5739 (15%) | 40902 (14%) | 90468 (14%) | |
50-59 Yrs | 5803 (15%) | 39970 (14%) | 84046 (13%) | |
60-69 Yrs | 4281 (11%) | 30366 (10%) | 66728 (10%) | |
70+ Yrs | 5743 (15%) | 43937 (15%) | 81301 (13%) | |
Median HH Income | $54,983 | $45,140 | $51,244 | |
Total Household Income | < 24K | 3626 (23%) | 31043 (30%) | 69008 (28%) |
25-49K | 3639 (23%) | 24049 (23%) | 48577 (20%) | |
50-74K | 2634 (16%) | 14351 (13%) | 32397 (13%) | |
75-99K | 1665 (10%) | 9111 (8%) | 23327 (9%) | |
100-199K | 2775 (17%) | 15082 (14%) | 39437 (16%) | |
200K+ | 1225 (7%) | 9199 (8%) | 25937 (10%) | |
Highest Education Level | No Diploma | 3240 | 39334 | 80065 |
Diploma or GED | 7182 | 59447 | 112941 | |
Some College | 3901 | 25381 | 56285 | |
Assoc. Degree | 2349 | 16577 | 33553 | |
Bachelors Degree | 7390 | 41467 | 100912 | |
Higher Degree | 5567 | 29183 | 81793 | |
Total Housing Units | 18,048 | 115,662 | 286,034 | |
--Owner-Occupied | 5,927 | 44,303 | 93,680 | |
--Renter-Occupied | 9,636 | 58,532 | 145,003 | |
Owner-Occupied Values | < 100K | 321 | 1952 | 5148 |
100-199K | 635 | 4840 | 9520 | |
200-299K | 1106 | 8559 | 19085 | |
300-399K | 1384 | 8023 | 16518 | |
400-499K | 671 | 4871 | 9319 | |
500K+ | 1809 | 16057 | 34091 | |
Total Working Age Population | 32,413 | 237,598 | 519,447 | |
In Work Force | 20,986 | 144,961 | 325,584 | |
Not In Work Force | 11,428 | 92,637 | 193,862 | |
Workforce Employed | 20,185 | 138,215 | 309,483 | |
Workforce Unemployed | 795 | 6,705 | 15,908 | |
Civlian Workforce | 20,980 | 144,920 | 325,391 | |
Military Workforce | 5 | 41 | 193 | |
Total Households | 15,563 | 102,834 | 238,684 | |
Family Households | 8,830 | 64,427 | 137,181 | |
Non-Family Households | 6,733 | 38,407 | 101,503 | |
Married Couple | 6,000 | 40,982 | 90,029 | |
Other Family | 2,831 | 23,445 | 47,152 | |
Married w/Child | 1,903 | 14,657 | 33,402 | |
Single Male w/Child | 206 | 2,003 | 4,294 | |
Single Female w/Child | 1,063 | 6,818 | 14,012 |
Population Change Last Two Decades - Plus Projection
2000 | % | 2010 | % | 2020 | % | 2030 | |
---|---|---|---|---|---|---|---|
Florida | 15,982,378 | +18 | 18,801,310 | +14 | 21,517,610 | +13 | 24,340,457 |
Miami-Dade County | 2,253,362 | +11 | 2,496,435 | +15 | 2,861,579 | +11 | 3,190,242 |
Monroe County | 79,589 | -8 | 73,090 | +1 | 74,004 | 0 | 74,301 |
Total Working Age Population:
Total Households:
Total Working Age Population:
Total Households:
Total Working Age Population:
Total Households: