• Sublease through: 3/31/2022
• Total square feet: 42,950 SF SF
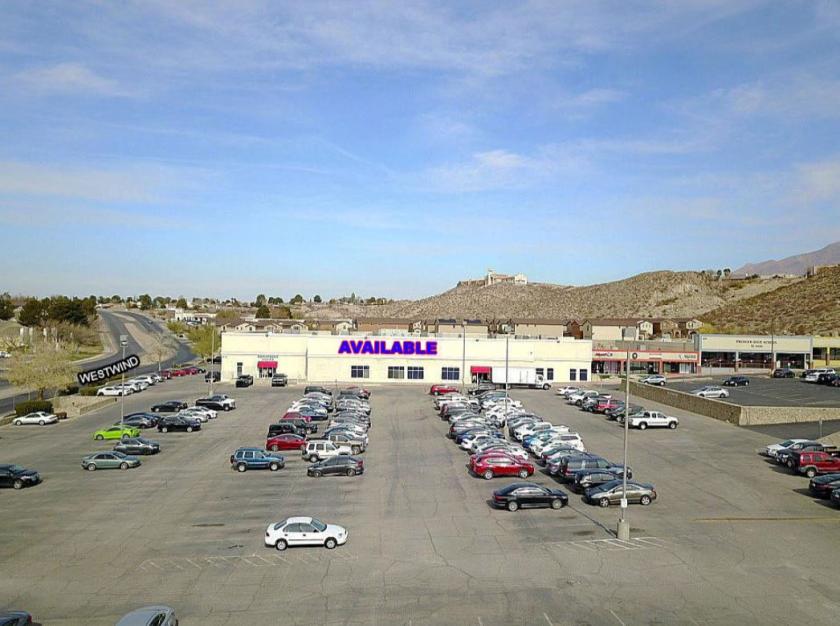
• Building signage available
• Call center / Back office
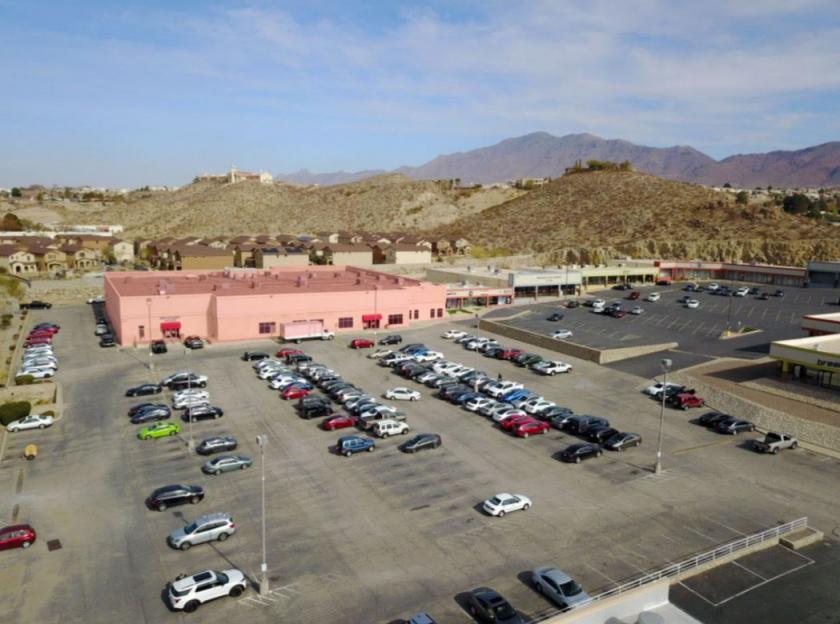
• Parking: 300 parking spaces
• ±6 miles to Interstate 10
• ±20.6 miles to El Paso International Airport
• Full compliment of furniture, fixtures, and equipment
• Population:
1-mile radius 17,239
3-mile radius 88,861
5-mile radius: 146,233 (Source: U.S. Census Bureau, ESRI forecasts for 2021)
No part of this information may be copied, reproduced, repurposed, or screen-captured for any commercial purpose without prior written authorization from MyEListing.
While we strive to provide the most accurate information, all listing information, and demographic data, is provided by third-parties. As such, MyEListing will not be responsible for the accuracy of the information. It is strongly recommended that you verify all information with the listing agent, and any relevant agencies, prior to making any decisions.
What is the building size of this commercial Office property?
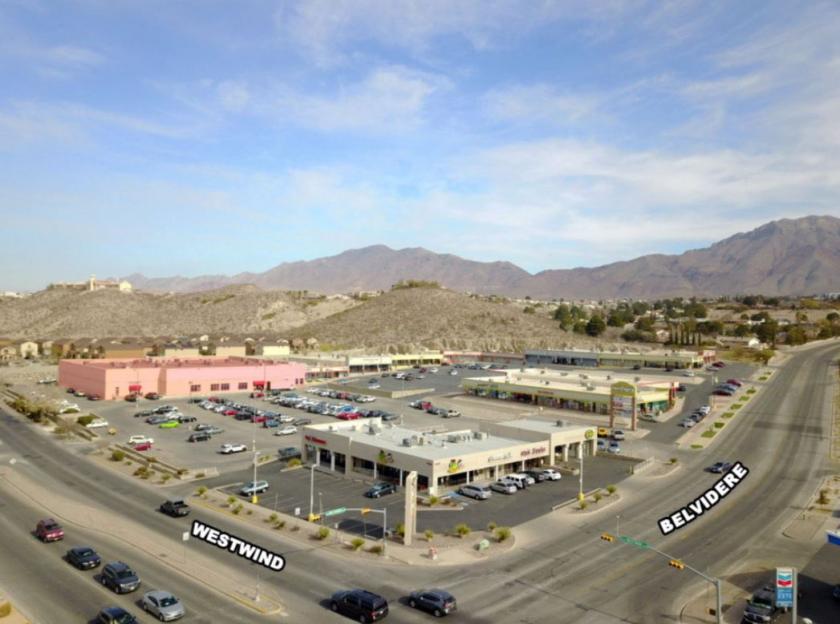
The size of this lease property at '.1015 Belvidere Street.' is 42950 square feet
What kind of Office is the propery at 1015 Belvidere Street?
The property at 1015 Belvidere Street El Paso, TX 79912 is listed as a Professional Office property
What is the population within 1 mile of 1015 Belvidere Street in El Paso?
The population within 1 mile of 1015 Belvidere Street El Paso, TX 79912 is 17,435 people.
Who do I contact for questions about 1015 Belvidere Street?
You should contact the listing agent,
Brett Preston, for any details regarding this commercial listing.