• Total space available: 6,582 SF (first floor)
• Total building size: 29,629 SF (two-story building)
• Lease type: Sublease
• Lease rate: $18/SF/YR (Full Service Gross)
• Sub lease expires: October 2020
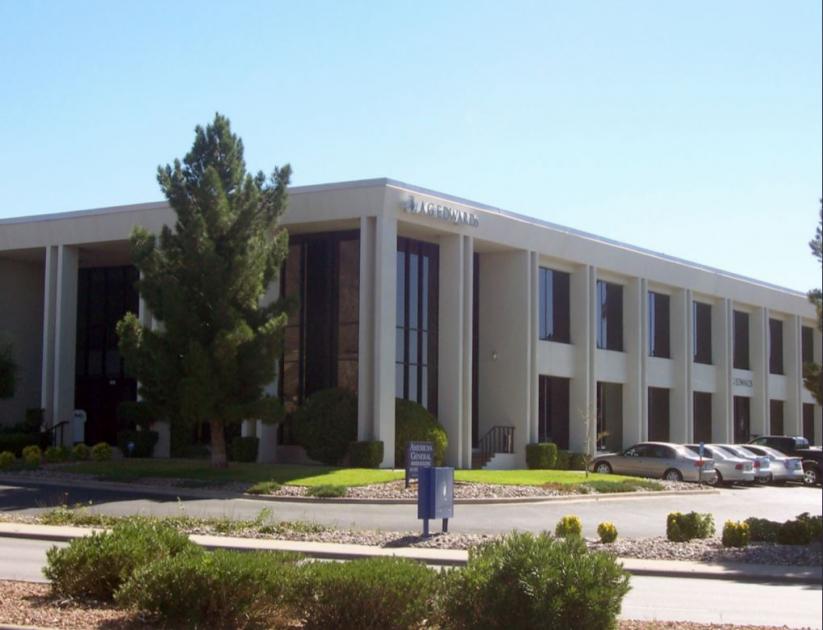
• Well maintained professional office park with lush landscaping and plentiful parking.
• Excellent location at the major intersection of Interstate 10 and Executive Center Blvd
• Prospective sub-lessee may discuss longer term lease with landlord.
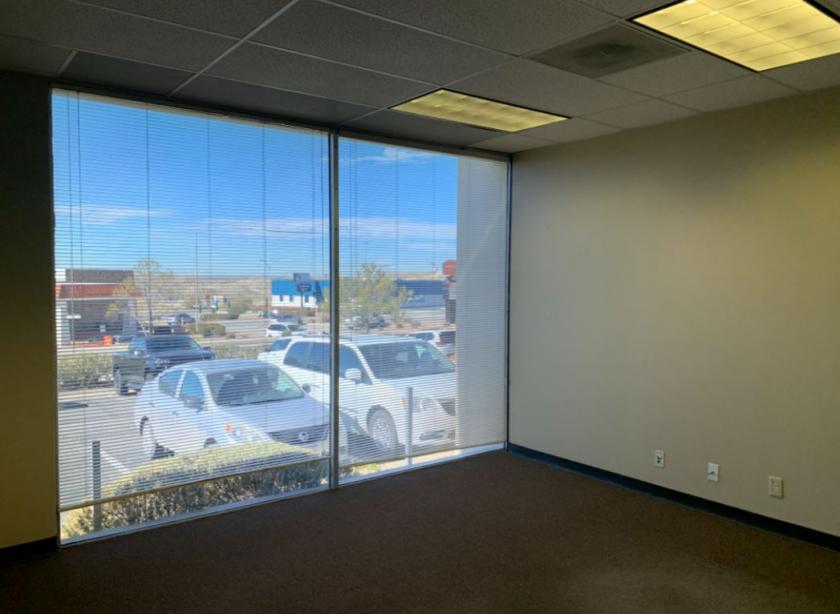
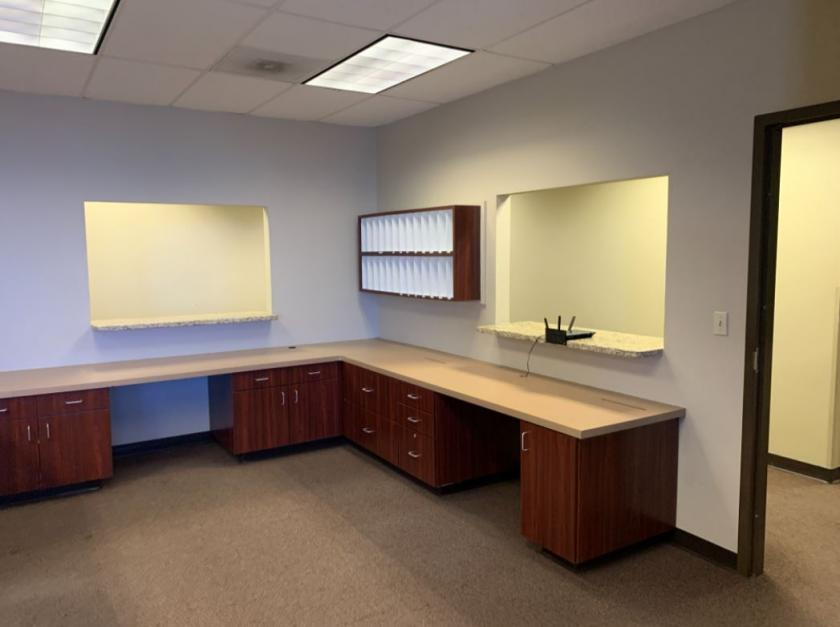
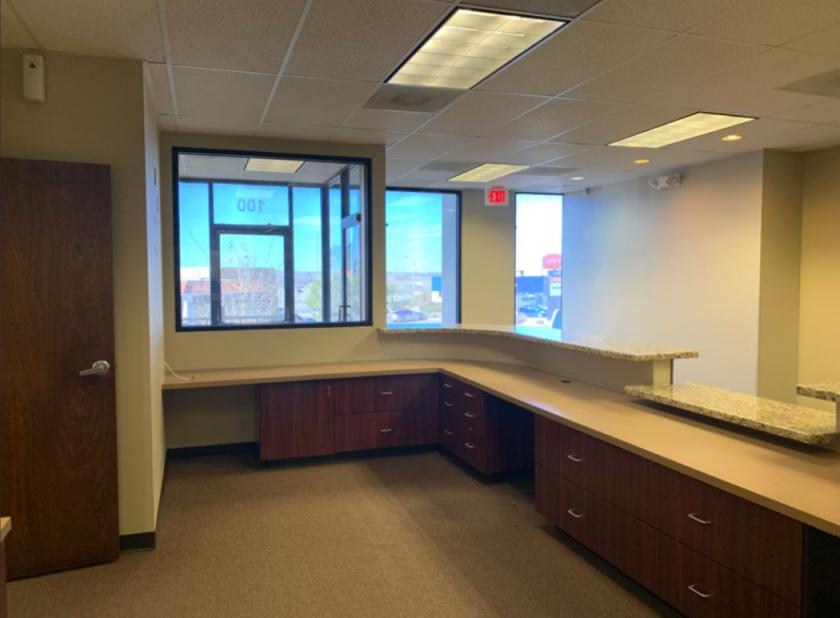
• Located on the first floor, the space is completely vacant and available for immediate occupancy.
• Great signage opportunities by combining the top corner of the building, the main entrance facing the street and a monument sign on Executive Center Blvd.
No part of this information may be copied, reproduced, repurposed, or screen-captured for any commercial purpose without prior written authorization from MyEListing.
While we strive to provide the most accurate information, all listing information, and demographic data, is provided by third-parties. As such, MyEListing will not be responsible for the accuracy of the information. It is strongly recommended that you verify all information with the listing agent, and any relevant agencies, prior to making any decisions.
What is the asking price for 444 Executive Center Boulevard in El Paso?
The asking price for 444 Executive Center Boulevard is $18.00 a SF per Year
What is the building size of this commercial Office property?
The size of this lease property at '.444 Executive Center Boulevard.' is 6582 square feet
What kind of Office is the propery at 444 Executive Center Boulevard?
The property at 444 Executive Center Boulevard El Paso, TX 79902 is listed as a Professional Office property
What is the population within 1 mile of 444 Executive Center Boulevard in El Paso?
The population within 1 mile of 444 Executive Center Boulevard El Paso, TX 79902 is 5,039 people.
Who do I contact for questions about 444 Executive Center Boulevard?
You should contact the listing agent,
Brett Preston, for any details regarding this commercial listing.