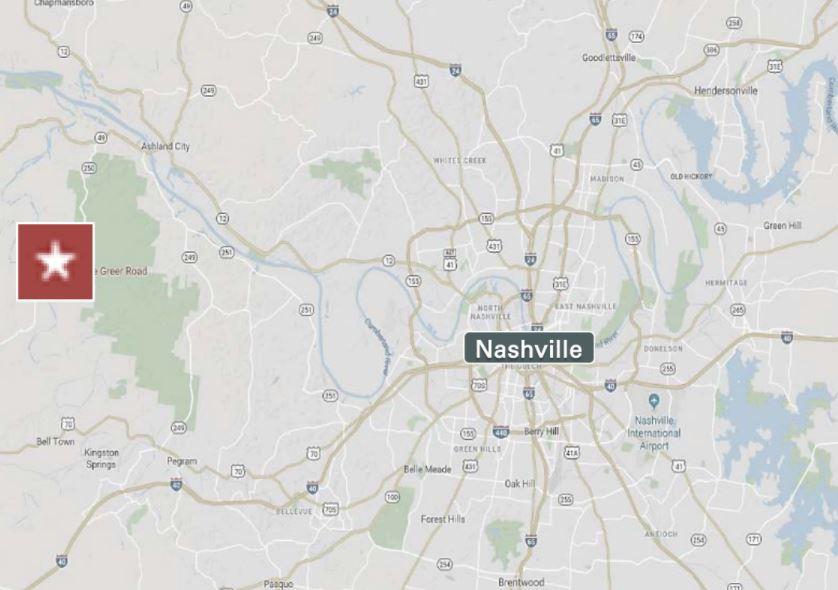
Commercial Land
1099 Lee Greer Road Ashland City, TN 37015
1099 Lee Greer Road Ashland City, TN 37015
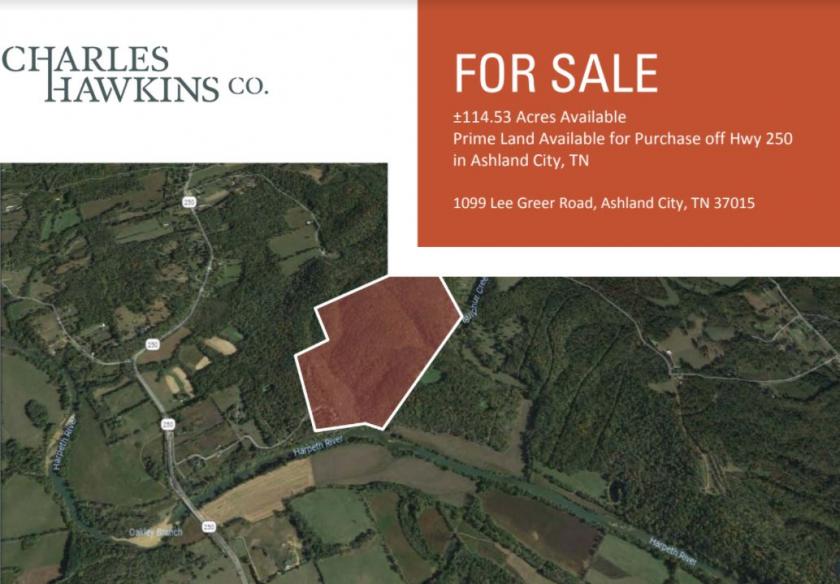
Details & Description
Listing Agents

Clancy Hoban
O: 615-345-7219
choban@charleshawkinsco.com
O: 615-345-7219
choban@charleshawkinsco.com

Charles Hawkins Commercial
Charles Hawkins Commercial
O: 615-256-3189
KGarland@charleshawkinsco.com
Charles Hawkins Commercial
O: 615-256-3189
KGarland@charleshawkinsco.com
While we strive to provide the most accurate information, all listing information, and demographic data, is provided by third-parties. As such, MyEListing will not be responsible for the accuracy of the information. It is strongly recommended that you verify all information with the listing agent, and any relevant agencies, prior to making any decisions.