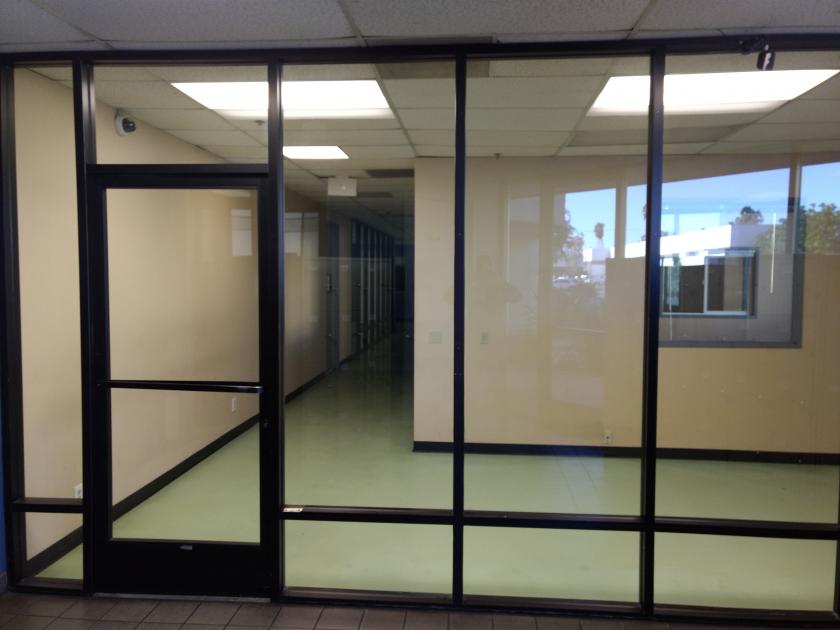
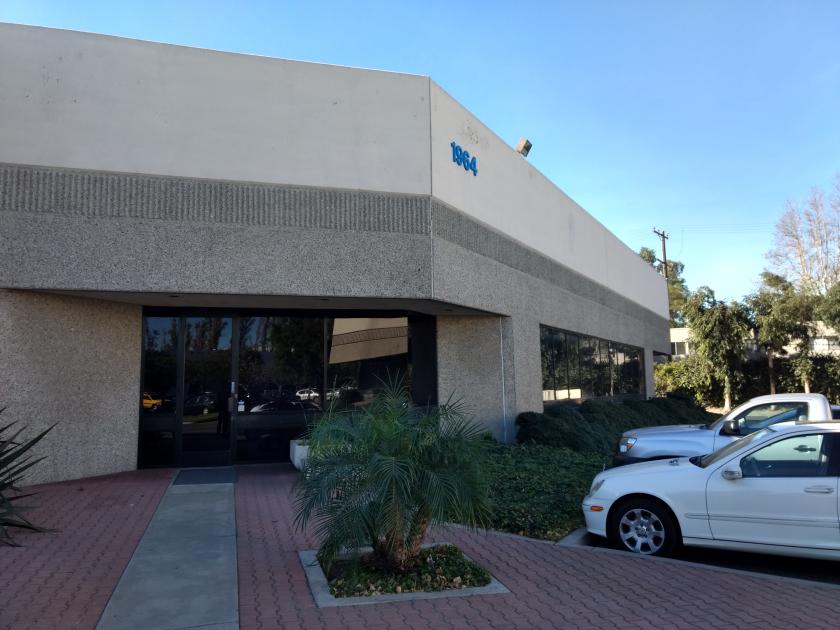
1-Mile | 3-Miles | 5-Miles | ||
---|---|---|---|---|
Total Population | 37,443 | 297,778 | 683,171 | |
Population Median Age | 34 | 35 | 37 | |
Population by Age | 0-9 Yrs | 5184 (13%) | 40982 (13%) | 87240 (12%) |
10-19 Yrs | 5513 (14%) | 42099 (14%) | 90793 (13%) | |
20-29 Yrs | 6924 (18%) | 49540 (16%) | 111650 (16%) | |
30-39 Yrs | 6188 (16%) | 43449 (14%) | 96144 (14%) | |
40-49 Yrs | 4657 (12%) | 39073 (13%) | 91070 (13%) | |
50-59 Yrs | 4371 (11%) | 35955 (12%) | 86852 (12%) | |
60-69 Yrs | 2616 (6%) | 24940 (8%) | 62563 (9%) | |
70+ Yrs | 1990 (5%) | 21742 (7%) | 56859 (8%) | |
Median HH Income | $66,737 | $65,750 | $70,331 | |
Total Household Income | < 24K | 1611 (15%) | 13883 (16%) | 30642 (15%) |
25-49K | 2260 (22%) | 17305 (21%) | 38556 (19%) | |
50-74K | 1868 (18%) | 15728 (19%) | 35205 (17%) | |
75-99K | 1512 (14%) | 11621 (14%) | 27889 (14%) | |
100-199K | 2467 (24%) | 19683 (23%) | 50247 (25%) | |
200K+ | 470 (4%) | 4003 (4%) | 13301 (6%) | |
Highest Education Level | No Diploma | 5298 | 49118 | 101060 |
Diploma or GED | 6369 | 48997 | 106454 | |
Some College | 5054 | 39419 | 93820 | |
Assoc. Degree | 1685 | 13094 | 33016 | |
Bachelors Degree | 4122 | 30721 | 85797 | |
Higher Degree | 1201 | 10069 | 32988 | |
Total Housing Units | 10,750 | 85,953 | 204,284 | |
--Owner-Occupied | 3,423 | 34,531 | 91,599 | |
--Renter-Occupied | 6,765 | 47,692 | 104,242 | |
Owner-Occupied Values | < 100K | 78 | 2038 | 4922 |
100-199K | 70 | 734 | 1541 | |
200-299K | 100 | 1256 | 2813 | |
300-399K | 468 | 3479 | 8026 | |
400-499K | 782 | 7882 | 18055 | |
500K+ | 1924 | 19142 | 56242 | |
Total Working Age Population | 28,976 | 231,431 | 541,443 | |
In Work Force | 20,496 | 154,032 | 356,568 | |
Not In Work Force | 8,480 | 77,399 | 184,876 | |
Workforce Employed | 19,354 | 145,013 | 337,200 | |
Workforce Unemployed | 1,142 | 8,890 | 19,153 | |
Civlian Workforce | 20,496 | 153,903 | 356,353 | |
Military Workforce | 0 | 129 | 215 | |
Total Households | 10,188 | 82,223 | 195,840 | |
Family Households | 7,778 | 61,840 | 147,649 | |
Non-Family Households | 2,409 | 20,383 | 48,191 | |
Married Couple | 5,023 | 42,083 | 103,182 | |
Other Family | 2,755 | 19,757 | 44,467 | |
Married w/Child | 2,637 | 20,852 | 47,368 | |
Single Male w/Child | 298 | 2,167 | 5,096 | |
Single Female w/Child | 1,003 | 6,567 | 13,795 |
Population Change Last Two Decades - Plus Projection
2000 | % | 2010 | % | 2020 | % | 2030 | |
---|---|---|---|---|---|---|---|
California | 33,871,648 | +10 | 37,253,956 | +9 | 40,467,295 | +8 | 43,631,295 |
Los Angeles County | 9,519,338 | +3 | 9,818,605 | +6 | 10,369,367 | +4 | 10,759,850 |
Orange County | 2,846,289 | +6 | 3,010,232 | +8 | 3,257,087 | +5 | 3,431,096 |
Total Working Age Population:
Total Households:
Total Working Age Population:
Total Households:
Total Working Age Population:
Total Households: