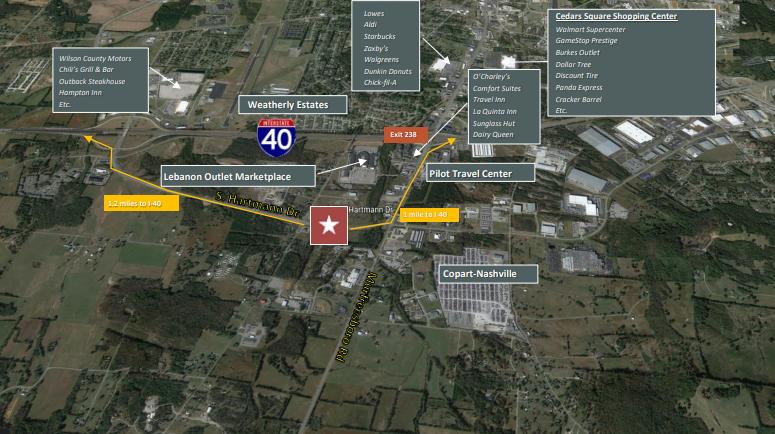
1-Mile | 3-Miles | 5-Miles | ||
---|---|---|---|---|
Total Population | 1,073 | 14,808 | 33,981 | |
Population Median Age | 38 | 39 | 39 | |
Population by Age | 0-9 Yrs | 117 (10%) | 1546 (10%) | 4256 (12%) |
10-19 Yrs | 163 (15%) | 2246 (15%) | 4356 (12%) | |
20-29 Yrs | 138 (12%) | 1924 (12%) | 4450 (13%) | |
30-39 Yrs | 146 (13%) | 2007 (13%) | 4827 (14%) | |
40-49 Yrs | 149 (13%) | 1793 (12%) | 3821 (11%) | |
50-59 Yrs | 150 (13%) | 1838 (12%) | 4178 (12%) | |
60-69 Yrs | 129 (12%) | 1637 (11%) | 4085 (12%) | |
70+ Yrs | 81 (7%) | 1816 (12%) | 4009 (11%) | |
Median HH Income | $61,974 | $44,717 | $55,070 | |
Total Household Income | < 24K | 78 (20%) | 1380 (25%) | 2600 (20%) |
25-49K | 95 (25%) | 1588 (28%) | 3111 (24%) | |
50-74K | 60 (15%) | 1007 (18%) | 2552 (20%) | |
75-99K | 76 (20%) | 669 (12%) | 1619 (12%) | |
100-199K | 64 (16%) | 701 (12%) | 2116 (16%) | |
200K+ | 7 (1%) | 137 (2%) | 493 (3%) | |
Highest Education Level | No Diploma | 177 | 1610 | 2976 |
Diploma or GED | 257 | 3762 | 8305 | |
Some College | 108 | 1958 | 4700 | |
Assoc. Degree | 42 | 610 | 1779 | |
Bachelors Degree | 112 | 1442 | 3672 | |
Higher Degree | 29 | 597 | 1658 | |
Total Housing Units | 432 | 6,150 | 13,589 | |
--Owner-Occupied | 193 | 2,677 | 7,447 | |
--Renter-Occupied | 185 | 2,803 | 5,045 | |
Owner-Occupied Values | < 100K | 59 | 385 | 857 |
100-199K | 76 | 1202 | 2559 | |
200-299K | 33 | 692 | 2209 | |
300-399K | 18 | 259 | 1060 | |
400-499K | 3 | 94 | 476 | |
500K+ | 3 | 45 | 286 | |
Total Working Age Population | 864 | 12,022 | 27,177 | |
In Work Force | 579 | 7,272 | 16,402 | |
Not In Work Force | 285 | 4,751 | 10,776 | |
Workforce Employed | 523 | 6,863 | 15,635 | |
Workforce Unemployed | 56 | 409 | 766 | |
Civlian Workforce | 579 | 7,272 | 16,401 | |
Military Workforce | 0 | 0 | 1 | |
Total Households | 379 | 5,481 | 12,492 | |
Family Households | 260 | 3,499 | 8,502 | |
Non-Family Households | 119 | 1,982 | 3,990 | |
Married Couple | 158 | 2,063 | 5,896 | |
Other Family | 102 | 1,436 | 2,606 | |
Married w/Child | 55 | 800 | 2,120 | |
Single Male w/Child | 6 | 104 | 203 | |
Single Female w/Child | 52 | 626 | 1,171 |
Population Change Last Two Decades - Plus Projection
2000 | % | 2010 | % | 2020 | % | 2030 | |
---|---|---|---|---|---|---|---|
Tennessee | 5,689,283 | +12 | 6,346,105 | +9 | 6,886,369 | +7 | 7,393,069 |
Rutherford County | 182,023 | +44 | 262,604 | +30 | 341,000 | +24 | 422,589 |
Sumner County | 130,449 | +23 | 160,645 | +20 | 193,462 | +15 | 223,258 |
Wilson County | 88,809 | +28 | 113,993 | +29 | 147,012 | +21 | 177,356 |
Total Working Age Population:
Total Households:
Total Working Age Population:
Total Households:
Total Working Age Population:
Total Households: