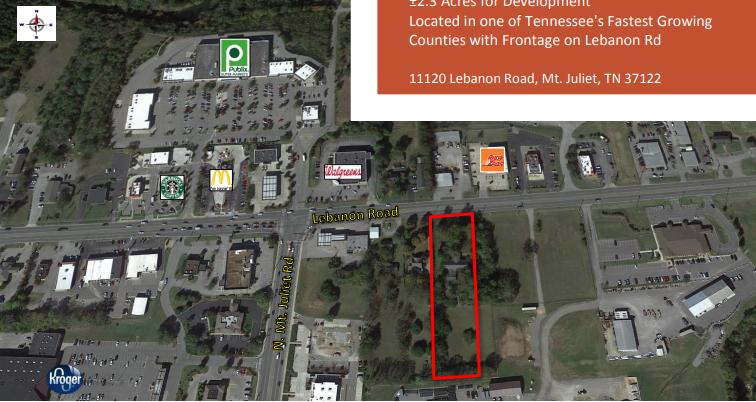
±2.3 Acres total
New Price: $1,400,000
Zoned: Commercial General
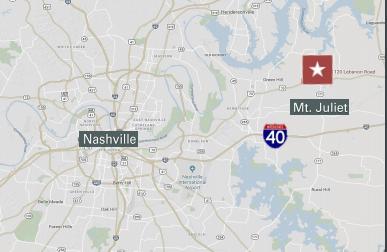
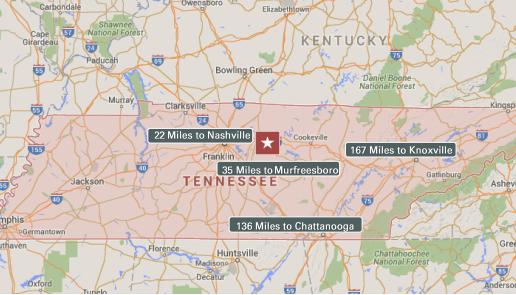
Key Distances
±1.9 Miles to Green Hill High School
±1.7 Miles to Nichols Vale Residential Development
±1.5 Miles to Sunset Point Residential Development
Key Retail at site Intersection:
Walgreens, Starbucks, Publix, Rite Aide, Kroger, AutoZone, etc.
Traffic Count: 19,400+ (2016) on Lebanon Road
Located in one of TN’s fastest growing counties
Mt Juliet Chamber of Commerce (click here)
No part of this information may be copied, reproduced, repurposed, or screen-captured for any commercial purpose without prior written authorization from MyEListing.
While we strive to provide the most accurate information, all listing information, and demographic data, is provided by third-parties. As such, MyEListing will not be responsible for the accuracy of the information. It is strongly recommended that you verify all information with the listing agent, and any relevant agencies, prior to making any decisions.
What is the asking price for 11120 Lebanon Road in Mt Juliet?
The asking price for 11120 Lebanon Road is $1,400,000
How much land does the Mt Juliet, TN property at 11120 Lebanon Road include?
11120 Lebanon Road in Mt Juliet includes 2.300 acres of land
What is the population within 1 mile of 11120 Lebanon Road in Mt Juliet?
The population within 1 mile of 11120 Lebanon Road Mt Juliet, TN 37122 is 1,823 people.
Who do I contact for questions about 11120 Lebanon Road?
You should contact the listing agent,
Michael Groos, for any details regarding this commercial listing.