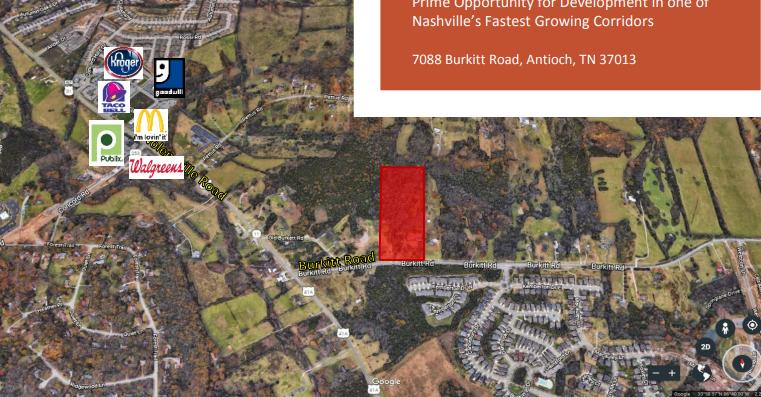
1-Mile | 3-Miles | 5-Miles | ||
---|---|---|---|---|
Total Population | 3,652 | 33,010 | 112,932 | |
Population Median Age | 37 | 36 | 34 | |
Population by Age | 0-9 Yrs | 461 (12%) | 4785 (14%) | 17434 (15%) |
10-19 Yrs | 459 (12%) | 4551 (13%) | 14775 (13%) | |
20-29 Yrs | 393 (10%) | 3454 (10%) | 15707 (13%) | |
30-39 Yrs | 679 (18%) | 5678 (17%) | 19964 (17%) | |
40-49 Yrs | 571 (15%) | 5299 (16%) | 16375 (14%) | |
50-59 Yrs | 522 (14%) | 4645 (14%) | 14090 (12%) | |
60-69 Yrs | 362 (9%) | 2979 (9%) | 9375 (8%) | |
70+ Yrs | 203 (5%) | 1619 (4%) | 5212 (4%) | |
Median HH Income | $102,944 | $105,709 | $79,097 | |
Total Household Income | < 24K | 101 (7%) | 788 (6%) | 4288 (10%) |
25-49K | 167 (11%) | 1293 (10%) | 7492 (18%) | |
50-74K | 207 (14%) | 1739 (14%) | 7841 (19%) | |
75-99K | 200 (14%) | 1682 (14%) | 5706 (13%) | |
100-199K | 499 (35%) | 4130 (35%) | 10673 (25%) | |
200K+ | 232 (16%) | 2163 (18%) | 5113 (12%) | |
Highest Education Level | No Diploma | 71 | 1102 | 6827 |
Diploma or GED | 365 | 2995 | 13204 | |
Some College | 436 | 3595 | 12505 | |
Assoc. Degree | 180 | 1606 | 5163 | |
Bachelors Degree | 888 | 7863 | 22950 | |
Higher Degree | 594 | 4948 | 13437 | |
Total Housing Units | 1,510 | 12,485 | 43,910 | |
--Owner-Occupied | 1,071 | 9,385 | 26,307 | |
--Renter-Occupied | 334 | 2,410 | 14,805 | |
Owner-Occupied Values | < 100K | 7 | 123 | 882 |
100-199K | 194 | 1524 | 6315 | |
200-299K | 225 | 1939 | 5759 | |
300-399K | 319 | 2287 | 4627 | |
400-499K | 107 | 1062 | 2598 | |
500K+ | 220 | 2449 | 6125 | |
Total Working Age Population | 2,870 | 25,153 | 85,754 | |
In Work Force | 2,177 | 18,861 | 64,853 | |
Not In Work Force | 693 | 6,293 | 20,901 | |
Workforce Employed | 2,122 | 18,327 | 62,772 | |
Workforce Unemployed | 52 | 501 | 1,993 | |
Civlian Workforce | 2,174 | 18,828 | 64,765 | |
Military Workforce | 3 | 33 | 88 | |
Total Households | 1,405 | 11,795 | 41,112 | |
Family Households | 994 | 8,877 | 28,276 | |
Non-Family Households | 411 | 2,919 | 12,836 | |
Married Couple | 814 | 7,390 | 21,821 | |
Other Family | 180 | 1,487 | 6,455 | |
Married w/Child | 368 | 3,680 | 10,973 | |
Single Male w/Child | 16 | 146 | 821 | |
Single Female w/Child | 51 | 477 | 2,795 |
Population Change Last Two Decades - Plus Projection
2000 | % | 2010 | % | 2020 | % | 2030 | |
---|---|---|---|---|---|---|---|
Tennessee | 5,689,283 | +12 | 6,346,105 | +9 | 6,886,369 | +7 | 7,393,069 |
Davidson County | 569,891 | +10 | 626,681 | +13 | 705,400 | +7 | 756,117 |
Rutherford County | 182,023 | +44 | 262,604 | +30 | 341,000 | +24 | 422,589 |
Williamson County | 126,638 | +45 | 183,182 | +33 | 244,052 | +25 | 304,687 |
Wilson County | 88,809 | +28 | 113,993 | +29 | 147,012 | +21 | 177,356 |
Total Working Age Population:
Total Households:
Total Working Age Population:
Total Households:
Total Working Age Population:
Total Households: