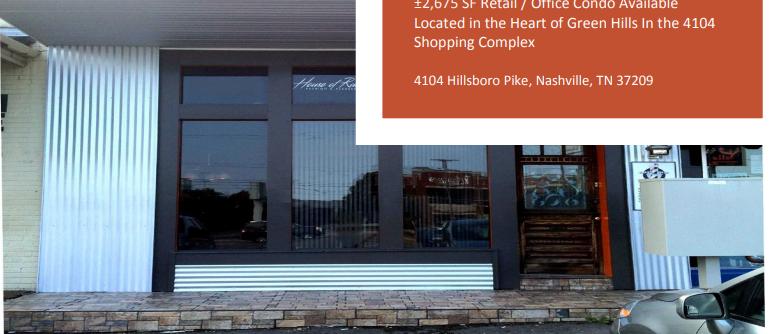
5 Retail / Office Suites Available
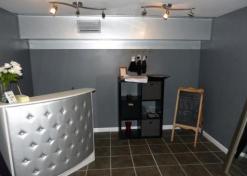
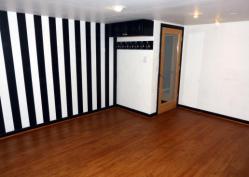
Perfect for personal services, salon, appointment-type retail, or office
Total square footage of condo: ±2,675 SF
Lease Rates: from $995 - $2,100/ Month FSG
SALE PRICE: PLEASE CALL
Shared break room, restrooms & common area
Well-lit front and back parking lots as well as customer access from both lots
Over 35,000 cars per day pass this location
Benefits from strong co-tenancy:
Same complex at the world-famous Blue Bird Café
Helen's Children Boutique; Green Hill's Cleaners; Harpeth Gallery, etc.
Located In the heart of Green Hills a highly desirable, affluent neighborhood 8 miles south of downtown; home to many national upscale retail brands & boutiques
*This condo provides street level access and is a lower level space
No part of this information may be copied, reproduced, repurposed, or screen-captured for any commercial purpose without prior written authorization from MyEListing.
While we strive to provide the most accurate information, all listing information, and demographic data, is provided by third-parties. As such, MyEListing will not be responsible for the accuracy of the information. It is strongly recommended that you verify all information with the listing agent, and any relevant agencies, prior to making any decisions.
What is the building size of this Office property in Nashville, TN?
The size of the building/unit at 4104 Hillsboro Pike in Nashville is 2,675 square feet
What is the population within 1 mile of 4104 Hillsboro Pike in Nashville?
The population within 1 mile of 4104 Hillsboro Pike Nashville, TN 37215 is 10,368 people.
Who do I contact for questions about 4104 Hillsboro Pike?
You should contact the listing agent,
Michael Groos, for any details regarding this commercial listing.