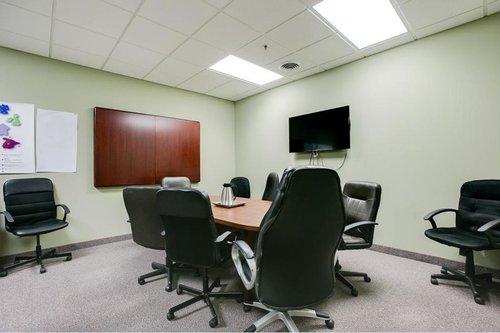
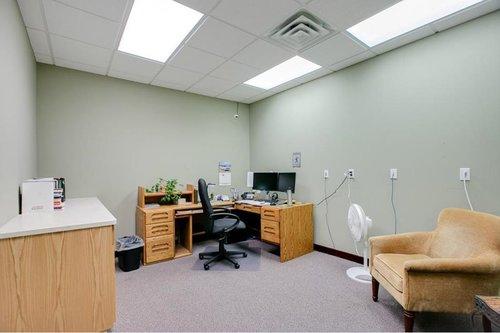
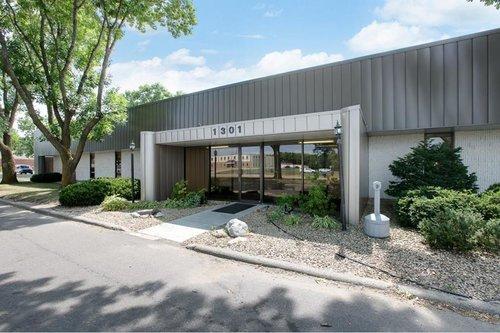
1-Mile | 3-Miles | 5-Miles | ||
---|---|---|---|---|
Total Population | 8,654 | 70,261 | 200,425 | |
Population Median Age | 37 | 39 | 39 | |
Population by Age | 0-9 Yrs | 1081 (12%) | 8438 (12%) | 25216 (12%) |
10-19 Yrs | 1109 (12%) | 8424 (11%) | 24221 (12%) | |
20-29 Yrs | 1375 (15%) | 10199 (14%) | 27147 (13%) | |
30-39 Yrs | 1096 (12%) | 9889 (14%) | 27422 (13%) | |
40-49 Yrs | 1150 (13%) | 8043 (11%) | 23979 (11%) | |
50-59 Yrs | 1254 (14%) | 9644 (13%) | 28625 (14%) | |
60-69 Yrs | 909 (10%) | 7835 (11%) | 22534 (11%) | |
70+ Yrs | 680 (7%) | 7790 (11%) | 21281 (10%) | |
Median HH Income | $69,827 | $73,087 | $77,442 | |
Total Household Income | < 24K | 398 (11%) | 3527 (12%) | 9412 (11%) |
25-49K | 820 (22%) | 5827 (20%) | 15167 (19%) | |
50-74K | 703 (19%) | 5256 (18%) | 13796 (17%) | |
75-99K | 581 (16%) | 4210 (14%) | 12078 (15%) | |
100-199K | 983 (27%) | 7823 (27%) | 22889 (28%) | |
200K+ | 129 (3%) | 1857 (6%) | 5769 (7%) | |
Highest Education Level | No Diploma | 419 | 3066 | 9557 |
Diploma or GED | 1328 | 10380 | 28758 | |
Some College | 1331 | 10982 | 29204 | |
Assoc. Degree | 542 | 5117 | 14534 | |
Bachelors Degree | 1661 | 13453 | 38626 | |
Higher Degree | 558 | 5564 | 17560 | |
Total Housing Units | 3,753 | 29,363 | 81,954 | |
--Owner-Occupied | 2,097 | 18,601 | 53,564 | |
--Renter-Occupied | 1,517 | 9,898 | 25,546 | |
Owner-Occupied Values | < 100K | 160 | 1509 | 3282 |
100-199K | 632 | 4204 | 11711 | |
200-299K | 965 | 7811 | 22707 | |
300-399K | 300 | 3506 | 10363 | |
400-499K | 31 | 1096 | 3510 | |
500K+ | 10 | 476 | 1992 | |
Total Working Age Population | 7,029 | 57,202 | 160,803 | |
In Work Force | 5,335 | 41,514 | 116,408 | |
Not In Work Force | 1,695 | 15,687 | 44,395 | |
Workforce Employed | 5,059 | 39,690 | 111,458 | |
Workforce Unemployed | 263 | 1,781 | 4,857 | |
Civlian Workforce | 5,322 | 41,471 | 116,315 | |
Military Workforce | 12 | 43 | 93 | |
Total Households | 3,614 | 28,499 | 79,110 | |
Family Households | 2,217 | 17,942 | 51,732 | |
Non-Family Households | 1,397 | 10,557 | 27,378 | |
Married Couple | 1,545 | 13,034 | 38,727 | |
Other Family | 672 | 4,908 | 13,006 | |
Married w/Child | 613 | 4,888 | 15,080 | |
Single Male w/Child | 150 | 687 | 2,126 | |
Single Female w/Child | 276 | 2,217 | 5,304 |
Population Change Last Two Decades - Plus Projection
2000 | % | 2010 | % | 2020 | % | 2030 | |
---|---|---|---|---|---|---|---|
Minnesota | 4,919,479 | +8 | 5,303,925 | +7 | 5,687,161 | +5 | 5,974,304 |
Dakota County | 355,904 | +12 | 398,552 | +9 | 434,203 | +7 | 463,564 |
Hennepin County | 1,116,200 | +3 | 1,152,425 | +12 | 1,294,371 | +9 | 1,407,332 |
Scott County | 89,498 | +45 | 129,928 | +18 | 152,927 | +13 | 172,140 |
Total Working Age Population:
Total Households:
Total Working Age Population:
Total Households:
Total Working Age Population:
Total Households: