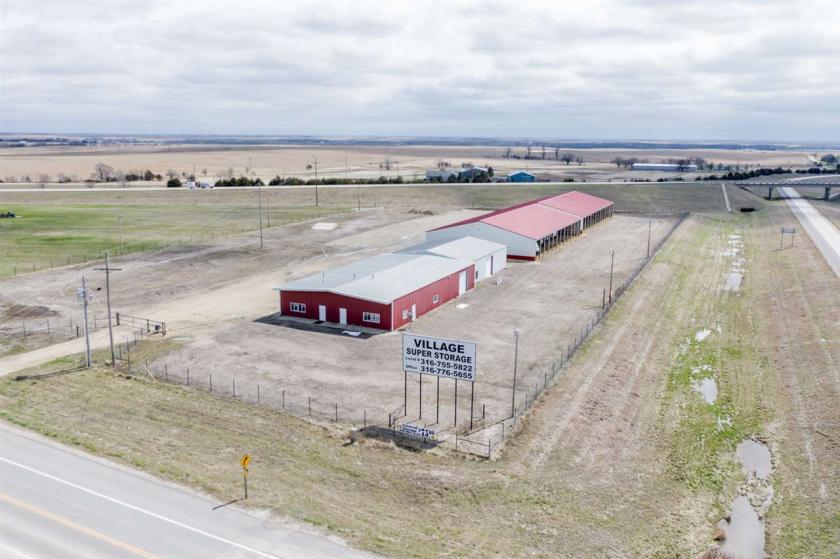
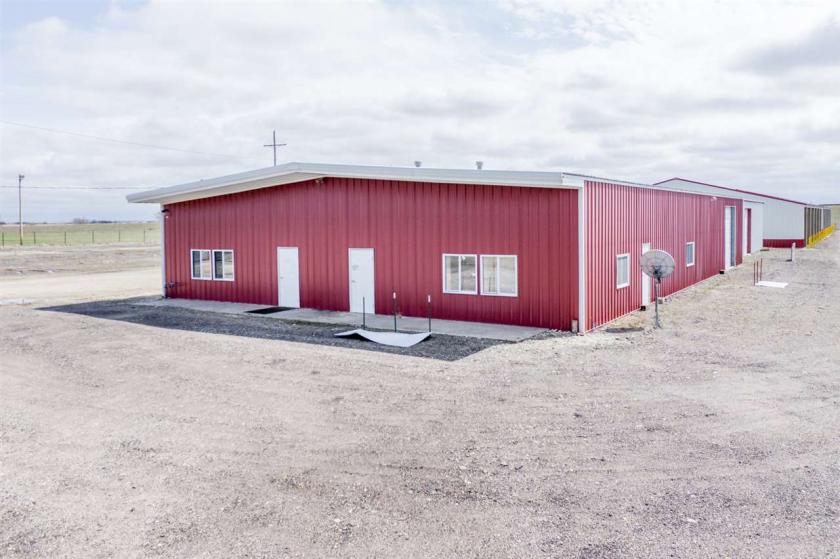
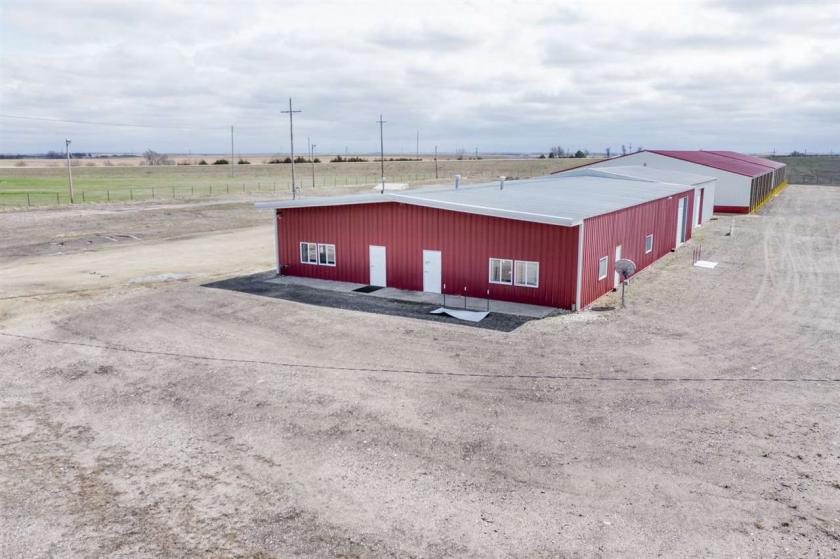
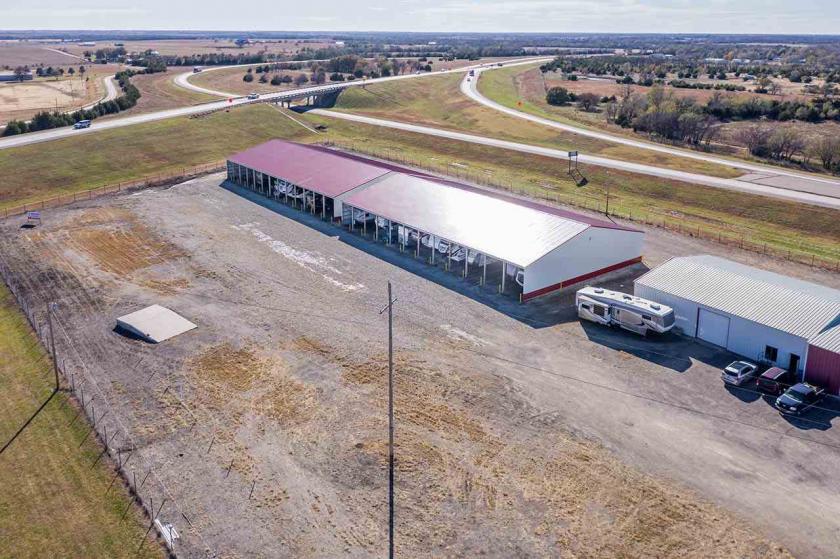
1-Mile | 3-Miles | 5-Miles | ||
---|---|---|---|---|
Total Population | 124 | 766 | 2,012 | |
Population Median Age | 44 | 43 | 43 | |
Population by Age | 0-9 Yrs | 15 (12%) | 90 (11%) | 224 (11%) |
10-19 Yrs | 16 (12%) | 99 (12%) | 250 (12%) | |
20-29 Yrs | 7 (5%) | 45 (5%) | 151 (7%) | |
30-39 Yrs | 9 (7%) | 59 (7%) | 188 (9%) | |
40-49 Yrs | 16 (12%) | 103 (13%) | 287 (14%) | |
50-59 Yrs | 20 (16%) | 125 (16%) | 318 (15%) | |
60-69 Yrs | 29 (23%) | 174 (22%) | 403 (20%) | |
70+ Yrs | 12 (9%) | 72 (9%) | 190 (9%) | |
Median HH Income | $76,765 | $75,800 | $75,787 | |
Total Household Income | < 24K | 5 (9%) | 37 (11%) | 102 (13%) |
25-49K | 6 (11%) | 40 (12%) | 95 (12%) | |
50-74K | 13 (25%) | 78 (24%) | 185 (23%) | |
75-99K | 18 (35%) | 104 (33%) | 235 (30%) | |
100-199K | 7 (13%) | 48 (15%) | 137 (17%) | |
200K+ | 1 (1%) | 9 (2%) | 25 (3%) | |
Highest Education Level | No Diploma | 5 | 32 | 107 |
Diploma or GED | 25 | 158 | 433 | |
Some College | 34 | 210 | 516 | |
Assoc. Degree | 8 | 48 | 122 | |
Bachelors Degree | 16 | 96 | 241 | |
Higher Degree | 2 | 17 | 57 | |
Total Housing Units | 55 | 342 | 841 | |
--Owner-Occupied | 49 | 298 | 726 | |
--Renter-Occupied | 2 | 17 | 53 | |
Owner-Occupied Values | < 100K | 6 | 46 | 124 |
100-199K | 30 | 171 | 396 | |
200-299K | 7 | 39 | 95 | |
300-399K | 4 | 24 | 70 | |
400-499K | 0 | 0 | 4 | |
500K+ | 3 | 17 | 38 | |
Total Working Age Population | 103 | 643 | 1,698 | |
In Work Force | 65 | 395 | 977 | |
Not In Work Force | 38 | 248 | 721 | |
Workforce Employed | 63 | 380 | 942 | |
Workforce Unemployed | 3 | 16 | 35 | |
Civlian Workforce | 65 | 395 | 977 | |
Military Workforce | 0 | 0 | 0 | |
Total Households | 51 | 315 | 779 | |
Family Households | 37 | 226 | 560 | |
Non-Family Households | 14 | 89 | 219 | |
Married Couple | 35 | 212 | 515 | |
Other Family | 2 | 14 | 45 | |
Married w/Child | 11 | 67 | 166 | |
Single Male w/Child | 0 | 1 | 2 | |
Single Female w/Child | 0 | 1 | 7 |
Population Change Last Two Decades - Plus Projection
2000 | % | 2010 | % | 2020 | % | 2030 | |
---|---|---|---|---|---|---|---|
Kansas | 2,688,418 | +6 | 2,853,118 | +5 | 2,988,194 | +5 | 3,140,008 |
Butler County | 59,482 | +11 | 65,880 | +3 | 67,627 | +4 | 70,001 |
Total Working Age Population:
Total Households:
Total Working Age Population:
Total Households:
Total Working Age Population:
Total Households: