Industrial Properties
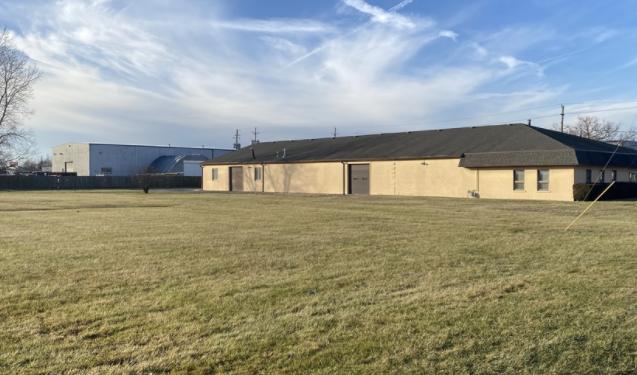
10544 Camille Court Indianapolis, IN 46236
10544 Camille Court Indianapolis, IN 46236
Details & Description
Listing Agents

Tom Ferguson
O: 317-454-7171
M: 317-714-7171
tferguson@premiercres.com
O: 317-454-7171
M: 317-714-7171
tferguson@premiercres.com
While we strive to provide the most accurate information, all listing information, and demographic data, is provided by third-parties. As such, MyEListing will not be responsible for the accuracy of the information. It is strongly recommended that you verify all information with the listing agent, and any relevant agencies, prior to making any decisions.


