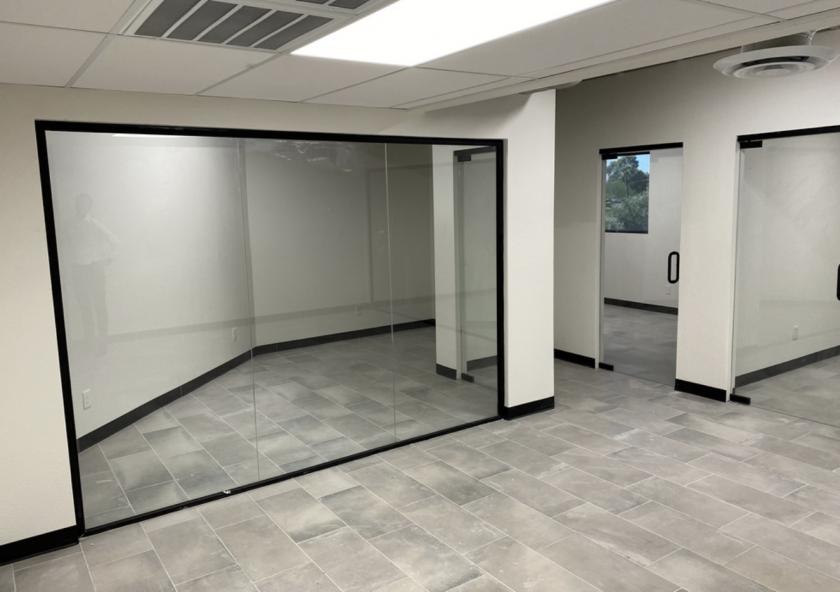
Office Space
1212 West Camelback Road Phoenix, AZ 85013
1212 West Camelback Road Phoenix, AZ 85013
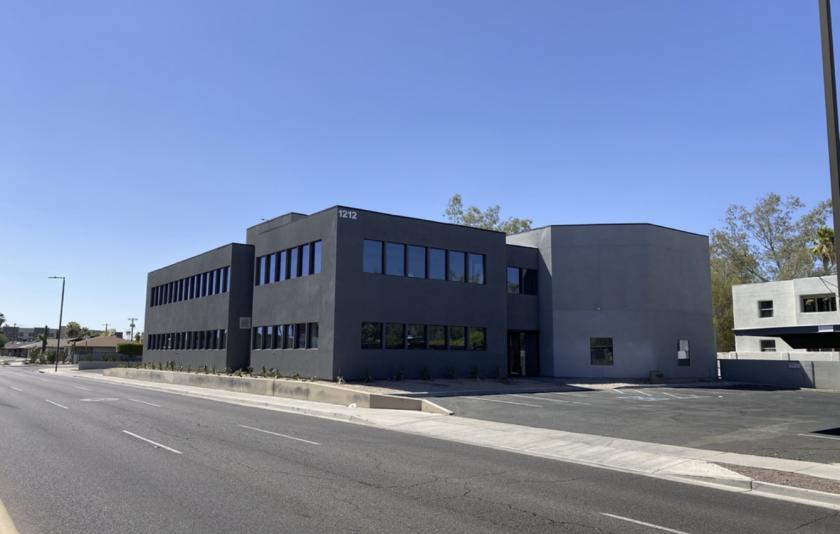
Details & Description
Listing Agents

Robert Roher
O: 602-912-3527
rroher@leearizona.com
O: 602-912-3527
rroher@leearizona.com
While we strive to provide the most accurate information, all listing information, and demographic data, is provided by third-parties. As such, MyEListing will not be responsible for the accuracy of the information. It is strongly recommended that you verify all information with the listing agent, and any relevant agencies, prior to making any decisions.