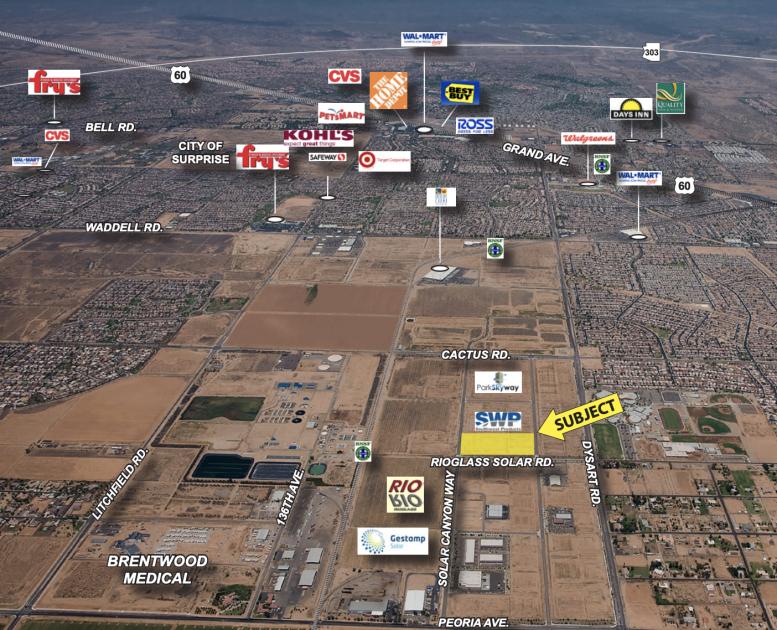
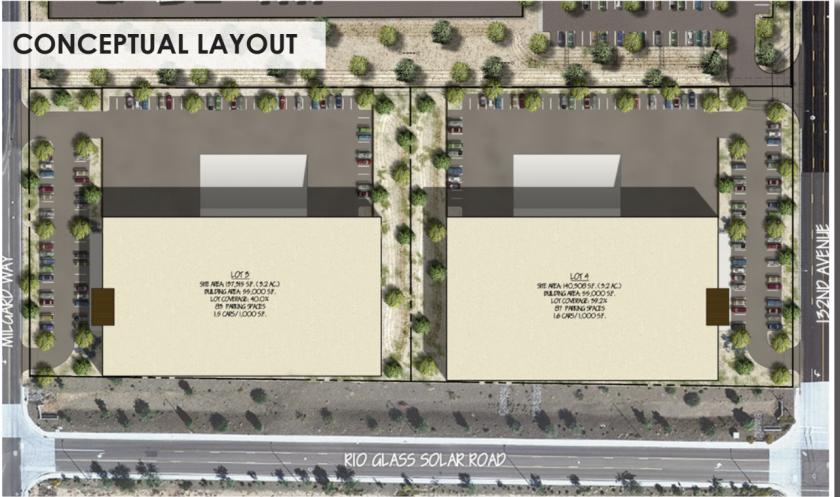
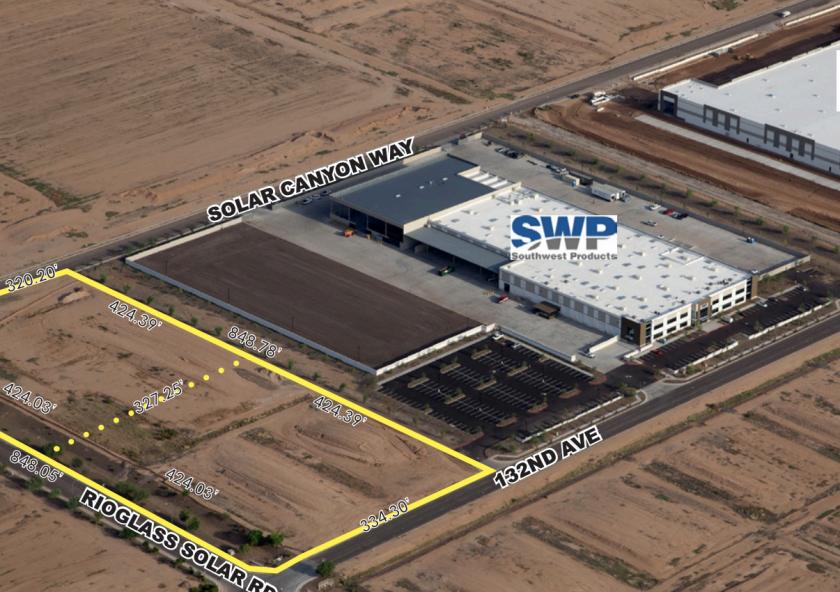
1-Mile | 3-Miles | 5-Miles | ||
---|---|---|---|---|
Total Population | 4,794 | 79,842 | 194,870 | |
Population Median Age | 33 | 35 | 42 | |
Population by Age | 0-9 Yrs | 717 (14%) | 11320 (14%) | 22602 (11%) |
10-19 Yrs | 895 (18%) | 13270 (16%) | 25330 (12%) | |
20-29 Yrs | 635 (13%) | 10773 (13%) | 22392 (11%) | |
30-39 Yrs | 747 (15%) | 11300 (14%) | 22211 (11%) | |
40-49 Yrs | 693 (14%) | 11230 (14%) | 23637 (12%) | |
50-59 Yrs | 591 (12%) | 8739 (10%) | 21058 (10%) | |
60-69 Yrs | 331 (6%) | 6588 (8%) | 22821 (11%) | |
70+ Yrs | 185 (3%) | 6622 (8%) | 34819 (17%) | |
Median HH Income | $61,285 | $61,928 | $55,759 | |
Total Household Income | < 24K | 166 (10%) | 3570 (14%) | 13342 (18%) |
25-49K | 364 (23%) | 6000 (23%) | 19249 (26%) | |
50-74K | 464 (29%) | 5827 (22%) | 15605 (21%) | |
75-99K | 274 (17%) | 4191 (16%) | 10981 (14%) | |
100-199K | 240 (15%) | 5025 (19%) | 12637 (17%) | |
200K+ | 47 (3%) | 743 (2%) | 1838 (2%) | |
Highest Education Level | No Diploma | 257 | 6896 | 15058 |
Diploma or GED | 859 | 14994 | 40061 | |
Some College | 837 | 13629 | 38212 | |
Assoc. Degree | 257 | 4631 | 13334 | |
Bachelors Degree | 499 | 6731 | 19527 | |
Higher Degree | 178 | 3312 | 10263 | |
Total Housing Units | 1,585 | 28,087 | 84,221 | |
--Owner-Occupied | 1,154 | 17,239 | 51,135 | |
--Renter-Occupied | 401 | 8,116 | 22,517 | |
Owner-Occupied Values | < 100K | 35 | 1864 | 7503 |
100-199K | 635 | 7495 | 22351 | |
200-299K | 366 | 5553 | 15189 | |
300-399K | 76 | 1601 | 3939 | |
400-499K | 25 | 412 | 1102 | |
500K+ | 17 | 314 | 1050 | |
Total Working Age Population | 3,540 | 59,719 | 156,124 | |
In Work Force | 2,518 | 39,332 | 86,620 | |
Not In Work Force | 1,022 | 20,387 | 69,504 | |
Workforce Employed | 2,368 | 36,867 | 80,222 | |
Workforce Unemployed | 144 | 2,076 | 4,857 | |
Civlian Workforce | 2,512 | 38,943 | 85,079 | |
Military Workforce | 6 | 389 | 1,541 | |
Total Households | 1,555 | 25,355 | 73,653 | |
Family Households | 1,180 | 19,029 | 48,238 | |
Non-Family Households | 375 | 6,326 | 25,415 | |
Married Couple | 871 | 12,833 | 35,731 | |
Other Family | 309 | 6,196 | 12,507 | |
Married w/Child | 476 | 5,763 | 12,014 | |
Single Male w/Child | 28 | 880 | 1,560 | |
Single Female w/Child | 161 | 2,511 | 4,611 |
Population Change Last Two Decades - Plus Projection
2000 | % | 2010 | % | 2020 | % | 2030 | |
---|---|---|---|---|---|---|---|
Arizona | 5,130,632 | +25 | 6,392,017 | +14 | 7,286,100 | +14 | 8,284,900 |
Maricopa County | 3,072,149 | +24 | 3,817,117 | +16 | 4,436,900 | +15 | 5,107,700 |
Total Working Age Population:
Total Households:
Total Working Age Population:
Total Households:
Total Working Age Population:
Total Households: