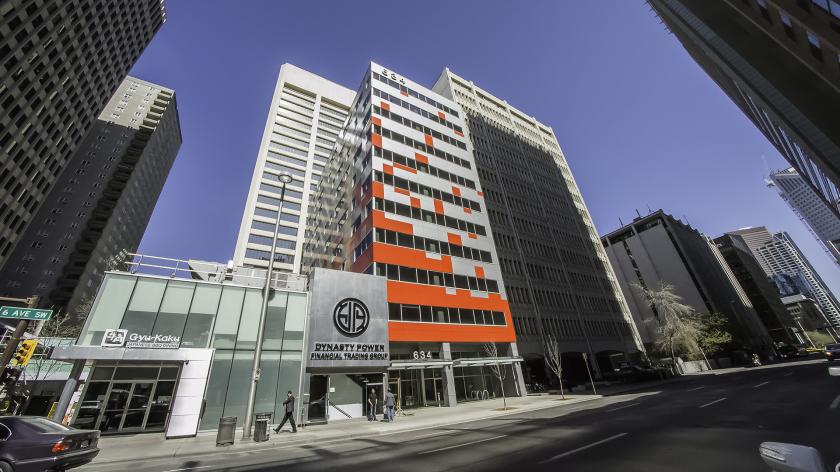
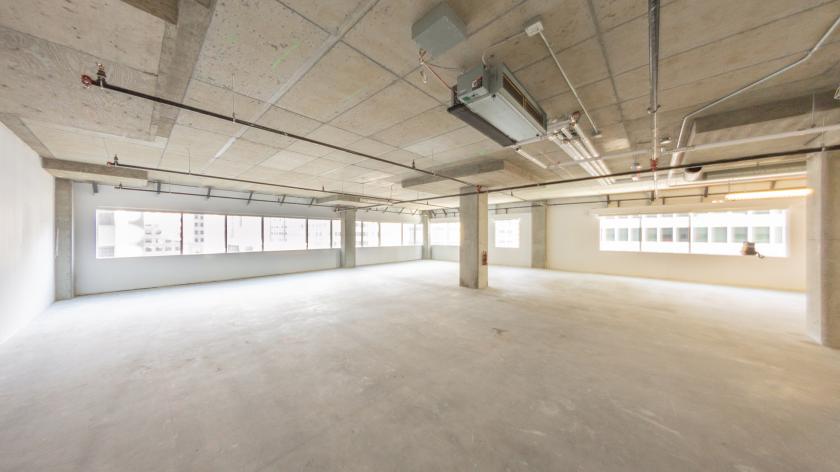
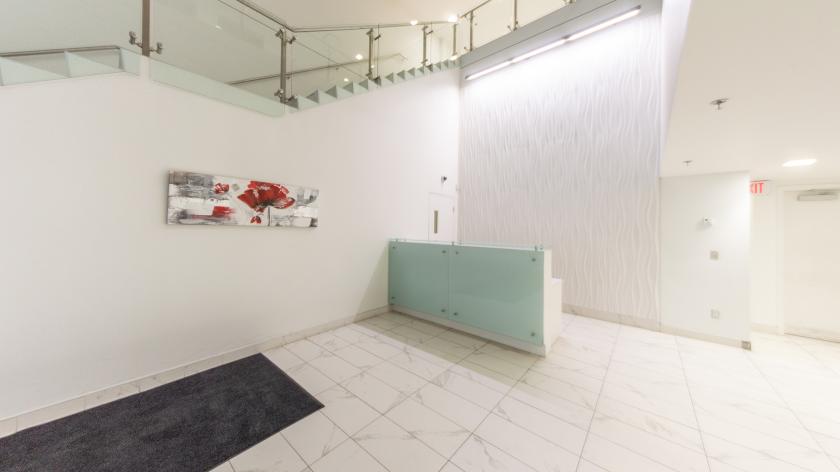
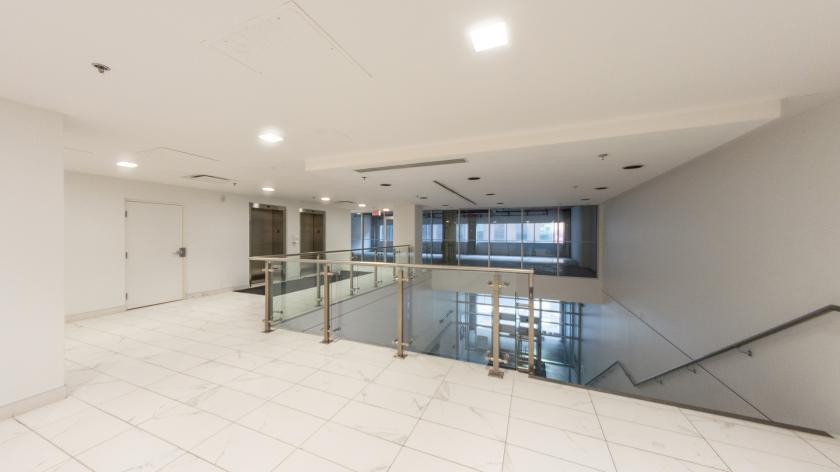
1-Mile | 3-Miles | 5-Miles | ||
---|---|---|---|---|
Total Population | 237,104 | 1,193,845 | 2,649,774 | |
Population Median Age | 40 | 39 | 38 | |
Population by Age | 0-9 Yrs | 12688 (5%) | 104812 (8%) | 273812 (10%) |
10-19 Yrs | 17666 (7%) | 76551 (6%) | 208158 (7%) | |
20-29 Yrs | 54741 (23%) | 232837 (19%) | 487203 (18%) | |
30-39 Yrs | 49847 (21%) | 273409 (22%) | 556304 (20%) | |
40-49 Yrs | 29157 (12%) | 156886 (13%) | 344362 (12%) | |
50-59 Yrs | 25999 (10%) | 127182 (10%) | 287013 (10%) | |
60-69 Yrs | 23683 (9%) | 108300 (9%) | 245018 (9%) | |
70+ Yrs | 23323 (9%) | 113870 (9%) | 247903 (9%) | |
Median HH Income | $123,996 | $114,456 | $92,843 | |
Total Household Income | < 24K | 17055 (13%) | 95614 (16%) | 221047 (18%) |
25-49K | 12447 (9%) | 62536 (10%) | 155110 (12%) | |
50-74K | 12372 (9%) | 56392 (9%) | 136516 (11%) | |
75-99K | 11707 (9%) | 52599 (8%) | 118455 (9%) | |
100-199K | 33575 (26%) | 154049 (26%) | 297111 (24%) | |
200K+ | 40049 (31%) | 170606 (28%) | 266211 (22%) | |
Highest Education Level | No Diploma | 7314 | 78775 | 228956 |
Diploma or GED | 13075 | 96065 | 296243 | |
Some College | 13042 | 73953 | 188081 | |
Assoc. Degree | 4951 | 28009 | 77602 | |
Bachelors Degree | 78242 | 351354 | 655348 | |
Higher Degree | 69788 | 307995 | 555192 | |
Total Housing Units | 147,863 | 694,026 | 1,366,842 | |
--Owner-Occupied | 39,166 | 158,670 | 316,482 | |
--Renter-Occupied | 88,040 | 433,126 | 877,967 | |
Owner-Occupied Values | < 100K | 1848 | 4293 | 9343 |
100-199K | 1558 | 3853 | 9481 | |
200-299K | 897 | 4039 | 16044 | |
300-399K | 1157 | 7809 | 21324 | |
400-499K | 1977 | 10033 | 21853 | |
500K+ | 31729 | 128642 | 238437 | |
Total Working Age Population | 218,978 | 1,048,187 | 2,253,692 | |
In Work Force | 159,383 | 754,919 | 1,577,708 | |
Not In Work Force | 59,595 | 293,268 | 675,985 | |
Workforce Employed | 152,780 | 725,361 | 1,502,490 | |
Workforce Unemployed | 6,497 | 29,292 | 74,581 | |
Civlian Workforce | 159,277 | 754,653 | 1,577,071 | |
Military Workforce | 106 | 266 | 637 | |
Total Households | 127,206 | 591,796 | 1,194,450 | |
Family Households | 37,854 | 242,661 | 560,381 | |
Non-Family Households | 89,352 | 349,134 | 634,069 | |
Married Couple | 31,061 | 188,762 | 399,999 | |
Other Family | 6,793 | 53,899 | 160,382 | |
Married w/Child | 9,428 | 70,323 | 158,895 | |
Single Male w/Child | 744 | 4,970 | 13,696 | |
Single Female w/Child | 1,735 | 16,068 | 49,919 |
Population Change Last Two Decades - Plus Projection
2000 | % | 2010 | % | 2020 | % | 2030 | |
---|---|---|---|---|---|---|---|
New Jersey | 8,414,350 | +4 | 8,791,894 | +4 | 9,132,700 | +4 | 9,530,900 |
Bergen County | 884,118 | +2 | 905,116 | +7 | 967,500 | +7 | 1,031,500 |
Hudson County | 608,975 | +4 | 634,266 | +12 | 708,100 | +6 | 747,400 |
New York | 18,976,457 | +2 | 19,378,102 | +4 | 20,146,131 | +2 | 20,604,030 |
Bronx County | 1,332,650 | +4 | 1,385,108 | +10 | 1,519,809 | +6 | 1,604,168 |
Kings County | 2,465,326 | +2 | 2,504,700 | +9 | 2,738,283 | +5 | 2,863,996 |
New York County | 1,537,195 | +3 | 1,585,873 | +6 | 1,688,894 | +2 | 1,727,631 |
Queens County | 2,229,379 | 0 | 2,230,722 | +9 | 2,436,549 | +5 | 2,565,268 |
Total Working Age Population:
Total Households:
Total Working Age Population:
Total Households:
Total Working Age Population:
Total Households: