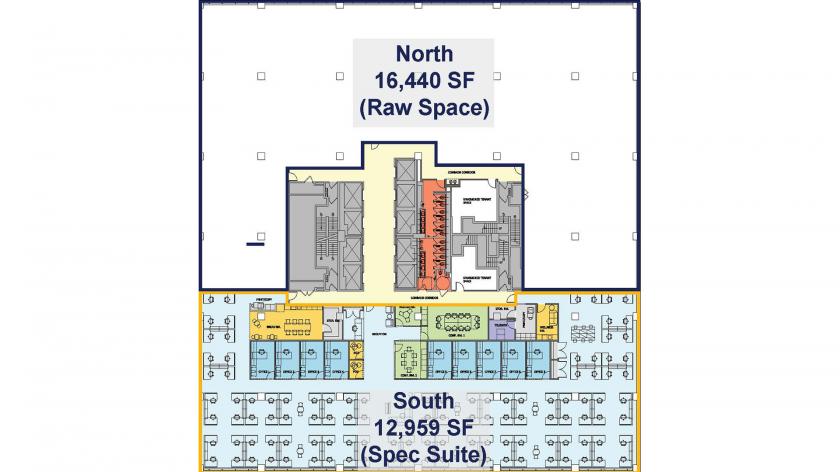
South Suite: 12,959 RSF
Plug & Play - Constructed & Furnished
~100 workstations, 9 private offices, 2 conference rooms, 1 huddle, 2 phone rooms, and kitchenette
North Suite: 6,431 - 16,440 RSF
Currently raw space
Tenant Improvement Allowance Available
Conceptual test-fits shown in flyer
Full Floor: 29,399 RSF
Expanded window line and unobstructed views
Fully renovated common areas & restrooms
Building Amenities
Tenant-only gym with showers and lockers; conferencing facility (10-seat) & training facility (36-seat)
Saxby's Coffee & Marathon Grill
24/7 Security
No part of this information may be copied, reproduced, repurposed, or screen-captured for any commercial purpose without prior written authorization from MyEListing.
While we strive to provide the most accurate information, all listing information, and demographic data, is provided by third-parties. As such, MyEListing will not be responsible for the accuracy of the information. It is strongly recommended that you verify all information with the listing agent, and any relevant agencies, prior to making any decisions.
What is the building size of this commercial Office property?
The size of this multi-unit property varies between 6431 - 29399 square feet
What kind of Office is the propery at 1818 Market Street?
The property at 1818 Market Street Philadelphia, PA 19103 is listed as a Professional Office property
What is the population within 1 mile of 1818 Market Street in Philadelphia?
The population within 1 mile of 1818 Market Street Philadelphia, PA 19103 is 82,779 people.
Who do I contact for questions about 1818 Market Street?
You should contact the listing agent,
Eric Pinchak, for any details regarding this commercial listing.