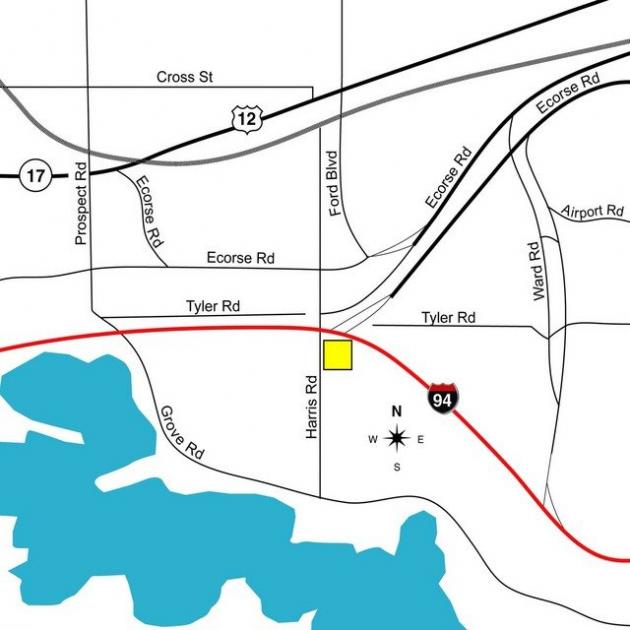
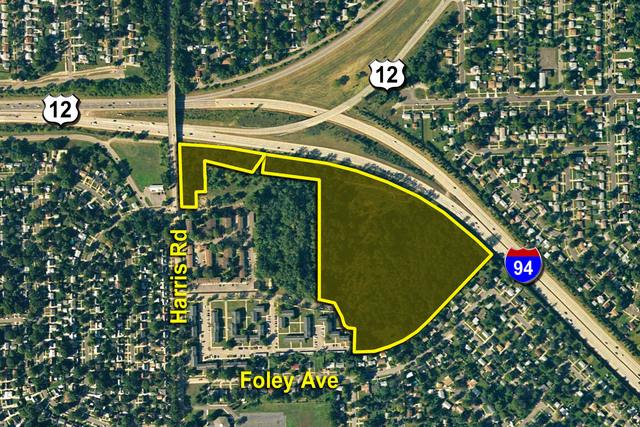
1-Mile | 3-Miles | 5-Miles | ||
---|---|---|---|---|
Total Population | 5,015 | 68,864 | 144,030 | |
Population Median Age | 35 | 34 | 36 | |
Population by Age | 0-9 Yrs | 745 (14%) | 6975 (10%) | 15984 (11%) |
10-19 Yrs | 564 (11%) | 9628 (13%) | 18961 (13%) | |
20-29 Yrs | 1076 (21%) | 18698 (27%) | 30946 (21%) | |
30-39 Yrs | 615 (12%) | 9184 (13%) | 20115 (13%) | |
40-49 Yrs | 586 (11%) | 7250 (10%) | 17456 (12%) | |
50-59 Yrs | 563 (11%) | 6742 (9%) | 15634 (10%) | |
60-69 Yrs | 494 (9%) | 5894 (8%) | 14135 (9%) | |
70+ Yrs | 371 (7%) | 4494 (6%) | 10798 (7%) | |
Median HH Income | $45,248 | $50,507 | $58,196 | |
Total Household Income | < 24K | 632 (29%) | 7072 (24%) | 12804 (21%) |
25-49K | 535 (24%) | 7024 (24%) | 12831 (21%) | |
50-74K | 288 (13%) | 4858 (17%) | 10322 (17%) | |
75-99K | 251 (11%) | 3281 (11%) | 7284 (12%) | |
100-199K | 373 (17%) | 4964 (17%) | 11814 (20%) | |
200K+ | 89 (4%) | 1209 (4%) | 3751 (6%) | |
Highest Education Level | No Diploma | 311 | 3055 | 6537 |
Diploma or GED | 478 | 6224 | 15219 | |
Some College | 847 | 9411 | 20193 | |
Assoc. Degree | 332 | 3949 | 7367 | |
Bachelors Degree | 621 | 10409 | 21637 | |
Higher Degree | 462 | 7912 | 20816 | |
Total Housing Units | 2,305 | 30,347 | 62,532 | |
--Owner-Occupied | 882 | 11,860 | 30,410 | |
--Renter-Occupied | 1,285 | 16,549 | 28,395 | |
Owner-Occupied Values | < 100K | 175 | 2143 | 5900 |
100-199K | 308 | 4459 | 10798 | |
200-299K | 287 | 3823 | 7791 | |
300-399K | 72 | 1069 | 2598 | |
400-499K | 23 | 198 | 1119 | |
500K+ | 17 | 168 | 2204 | |
Total Working Age Population | 4,018 | 57,975 | 118,532 | |
In Work Force | 2,747 | 40,884 | 81,198 | |
Not In Work Force | 1,271 | 17,091 | 37,335 | |
Workforce Employed | 2,621 | 38,455 | 76,923 | |
Workforce Unemployed | 122 | 2,400 | 4,242 | |
Civlian Workforce | 2,743 | 40,856 | 81,165 | |
Military Workforce | 4 | 28 | 33 | |
Total Households | 2,167 | 28,409 | 58,805 | |
Family Households | 1,116 | 13,253 | 31,144 | |
Non-Family Households | 1,051 | 15,155 | 27,661 | |
Married Couple | 697 | 8,998 | 21,479 | |
Other Family | 418 | 4,256 | 9,665 | |
Married w/Child | 294 | 3,542 | 8,518 | |
Single Male w/Child | 51 | 530 | 1,141 | |
Single Female w/Child | 176 | 1,613 | 3,872 |
Population Change Last Two Decades - Plus Projection
2000 | % | 2010 | % | 2020 | % | 2030 | |
---|---|---|---|---|---|---|---|
Michigan | 9,938,444 | -1 | 9,883,640 | +1 | 10,023,423 | +4 | 10,424,510 |
Washtenaw County | 322,895 | +7 | 344,791 | +9 | 376,857 | +12 | 422,684 |
Wayne County | 2,061,162 | -12 | 1,820,584 | -4 | 1,741,463 | -1 | 1,730,000 |
Total Working Age Population:
Total Households:
Total Working Age Population:
Total Households:
Total Working Age Population:
Total Households: