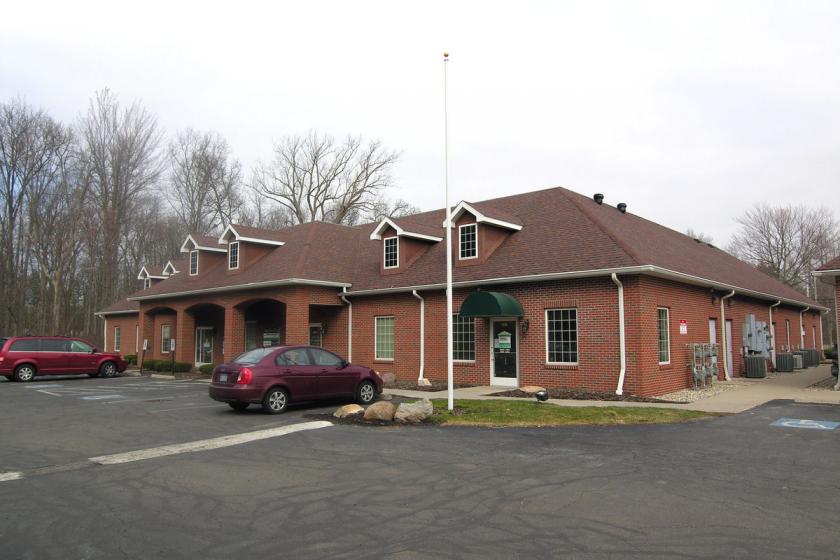
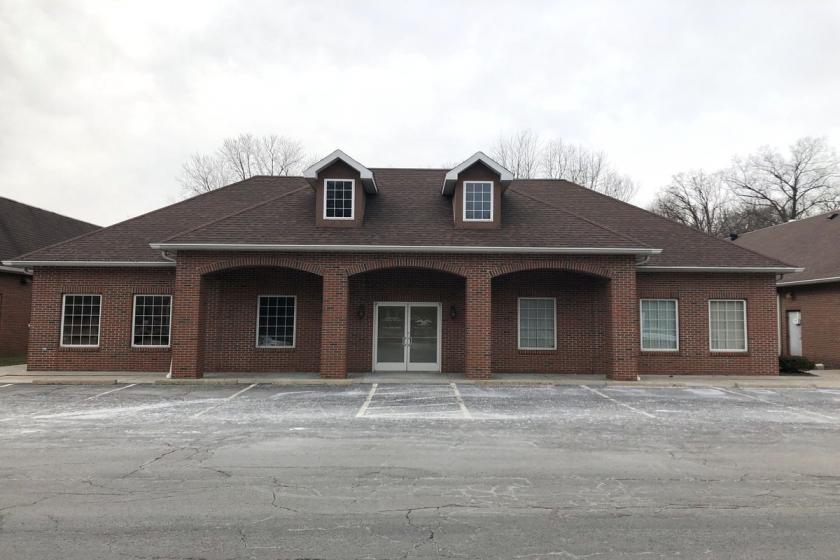
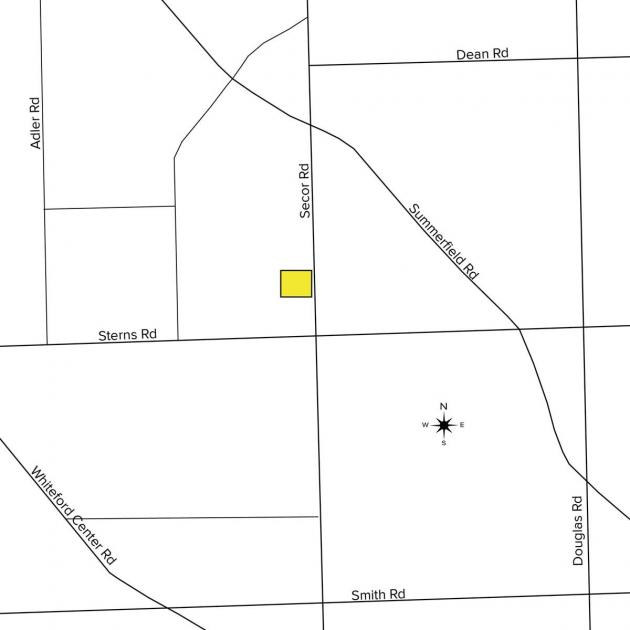
1-Mile | 3-Miles | 5-Miles | ||
---|---|---|---|---|
Total Population | 5,383 | 41,353 | 117,921 | |
Population Median Age | 41 | 41 | 39 | |
Population by Age | 0-9 Yrs | 827 (15%) | 4886 (11%) | 14277 (12%) |
10-19 Yrs | 520 (9%) | 5182 (12%) | 14653 (12%) | |
20-29 Yrs | 534 (9%) | 5034 (12%) | 16318 (13%) | |
30-39 Yrs | 643 (11%) | 4931 (11%) | 14794 (12%) | |
40-49 Yrs | 596 (11%) | 4966 (12%) | 15039 (12%) | |
50-59 Yrs | 911 (16%) | 6007 (14%) | 16486 (13%) | |
60-69 Yrs | 618 (11%) | 5274 (12%) | 13439 (11%) | |
70+ Yrs | 734 (13%) | 5073 (12%) | 12914 (10%) | |
Median HH Income | $73,479 | $59,810 | $56,286 | |
Total Household Income | < 24K | 304 (14%) | 3043 (17%) | 9856 (19%) |
25-49K | 436 (20%) | 4007 (23%) | 12181 (24%) | |
50-74K | 326 (15%) | 3380 (19%) | 9962 (20%) | |
75-99K | 277 (13%) | 2089 (12%) | 6560 (13%) | |
100-199K | 687 (32%) | 3992 (23%) | 9795 (19%) | |
200K+ | 66 (3%) | 601 (3%) | 1350 (2%) | |
Highest Education Level | No Diploma | 227 | 1945 | 6210 |
Diploma or GED | 949 | 9196 | 25863 | |
Some College | 807 | 7259 | 20778 | |
Assoc. Degree | 425 | 3611 | 9466 | |
Bachelors Degree | 802 | 4745 | 13044 | |
Higher Degree | 534 | 2325 | 6939 | |
Total Housing Units | 2,158 | 18,123 | 53,645 | |
--Owner-Occupied | 1,869 | 12,843 | 33,478 | |
--Renter-Occupied | 227 | 4,271 | 16,226 | |
Owner-Occupied Values | < 100K | 99 | 2749 | 12188 |
100-199K | 831 | 6573 | 14658 | |
200-299K | 528 | 2430 | 4410 | |
300-399K | 229 | 613 | 1117 | |
400-499K | 75 | 220 | 431 | |
500K+ | 106 | 259 | 674 | |
Total Working Age Population | 4,262 | 33,265 | 94,671 | |
In Work Force | 2,582 | 21,253 | 62,402 | |
Not In Work Force | 1,679 | 12,012 | 32,270 | |
Workforce Employed | 2,529 | 20,352 | 59,065 | |
Workforce Unemployed | 42 | 865 | 3,271 | |
Civlian Workforce | 2,571 | 21,217 | 62,336 | |
Military Workforce | 12 | 36 | 66 | |
Total Households | 2,096 | 17,114 | 49,704 | |
Family Households | 1,518 | 11,174 | 30,508 | |
Non-Family Households | 578 | 5,939 | 19,196 | |
Married Couple | 1,334 | 8,519 | 21,566 | |
Other Family | 184 | 2,655 | 8,943 | |
Married w/Child | 530 | 3,062 | 7,752 | |
Single Male w/Child | 19 | 460 | 1,544 | |
Single Female w/Child | 47 | 1,163 | 3,923 |
Population Change Last Two Decades - Plus Projection
2000 | % | 2010 | % | 2020 | % | 2030 | |
---|---|---|---|---|---|---|---|
Michigan | 9,938,444 | -1 | 9,883,640 | +1 | 10,023,423 | +4 | 10,424,510 |
Monroe County | 145,945 | +4 | 152,021 | -2 | 149,610 | +2 | 153,038 |
Ohio | 11,353,140 | +2 | 11,536,504 | 0 | 11,574,870 | 0 | 11,615,100 |
Lucas County | 455,054 | -3 | 441,815 | -3 | 430,450 | -2 | 420,080 |
Total Working Age Population:
Total Households:
Total Working Age Population:
Total Households:
Total Working Age Population:
Total Households: