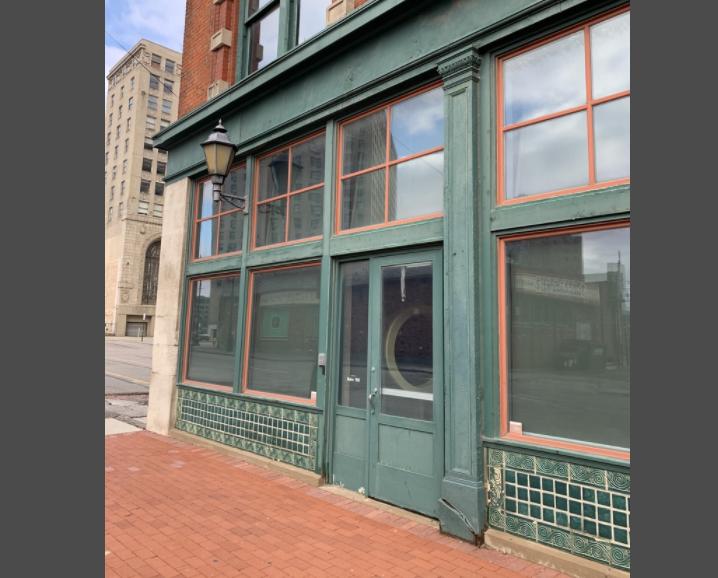
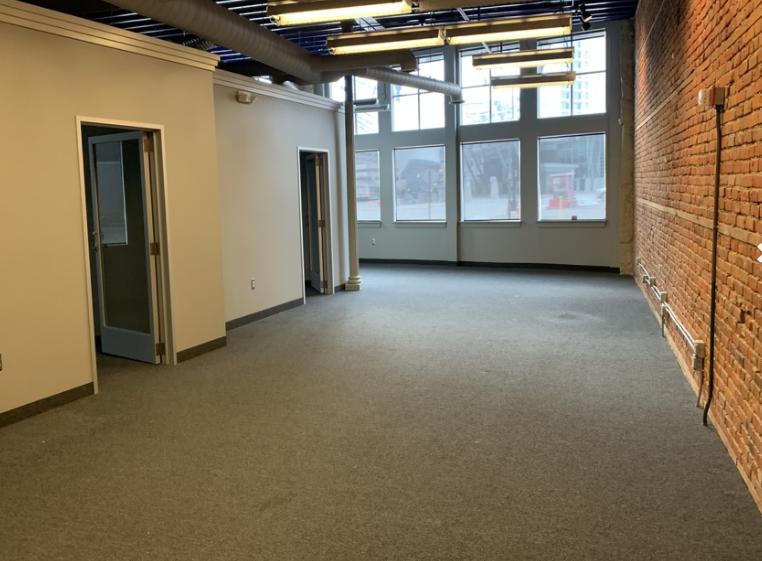
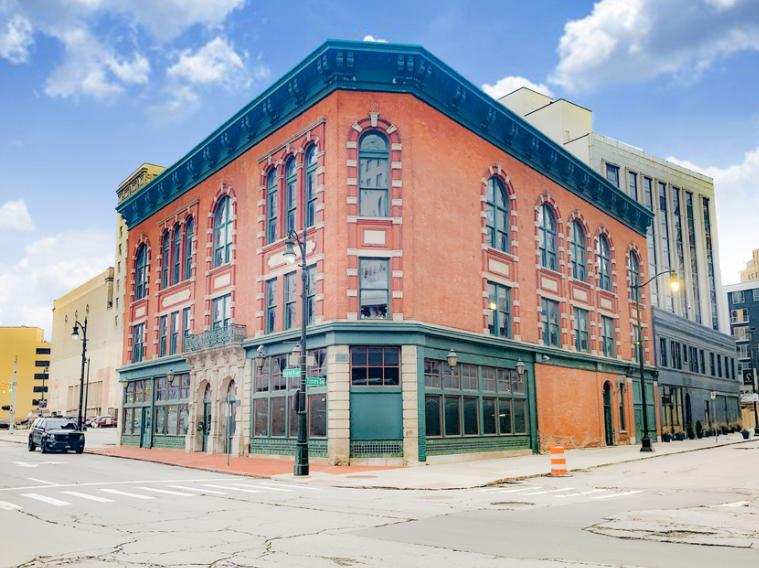
1-Mile | 3-Miles | 5-Miles | ||
---|---|---|---|---|
Total Population | 14,906 | 81,148 | 224,218 | |
Population Median Age | 39 | 39 | 37 | |
Population by Age | 0-9 Yrs | 684 (4%) | 7679 (9%) | 29675 (13%) |
10-19 Yrs | 575 (3%) | 7737 (9%) | 28313 (12%) | |
20-29 Yrs | 4790 (32%) | 18693 (23%) | 40241 (17%) | |
30-39 Yrs | 2807 (18%) | 11094 (13%) | 29642 (13%) | |
40-49 Yrs | 1381 (9%) | 8411 (10%) | 24697 (11%) | |
50-59 Yrs | 1645 (11%) | 9778 (12%) | 26894 (11%) | |
60-69 Yrs | 1904 (12%) | 10183 (12%) | 25840 (11%) | |
70+ Yrs | 1121 (7%) | 7574 (9%) | 18916 (8%) | |
Median HH Income | $50,713 | $29,340 | $28,975 | |
Total Household Income | < 24K | 2910 (32%) | 18920 (45%) | 42245 (44%) |
25-49K | 1502 (16%) | 8772 (21%) | 23819 (25%) | |
50-74K | 1485 (16%) | 5078 (12%) | 12141 (12%) | |
75-99K | 1137 (12%) | 3566 (8%) | 7086 (7%) | |
100-199K | 1385 (15%) | 3987 (9%) | 7487 (7%) | |
200K+ | 528 (5%) | 1211 (2%) | 1923 (2%) | |
Highest Education Level | No Diploma | 1116 | 9752 | 35246 |
Diploma or GED | 1855 | 13169 | 41172 | |
Some College | 2694 | 12695 | 30767 | |
Assoc. Degree | 565 | 3249 | 8156 | |
Bachelors Degree | 2863 | 10166 | 17999 | |
Higher Degree | 2909 | 8560 | 14058 | |
Total Housing Units | 11,293 | 52,021 | 132,517 | |
--Owner-Occupied | 1,425 | 9,552 | 33,725 | |
--Renter-Occupied | 7,521 | 31,981 | 60,976 | |
Owner-Occupied Values | < 100K | 178 | 4258 | 23943 |
100-199K | 294 | 2222 | 4484 | |
200-299K | 442 | 1558 | 2484 | |
300-399K | 301 | 818 | 1438 | |
400-499K | 124 | 363 | 649 | |
500K+ | 86 | 334 | 727 | |
Total Working Age Population | 13,927 | 69,764 | 178,802 | |
In Work Force | 8,704 | 38,535 | 93,361 | |
Not In Work Force | 5,223 | 31,228 | 85,441 | |
Workforce Employed | 8,240 | 34,403 | 82,709 | |
Workforce Unemployed | 443 | 4,111 | 10,590 | |
Civlian Workforce | 8,683 | 38,514 | 93,300 | |
Military Workforce | 21 | 21 | 61 | |
Total Households | 8,946 | 41,533 | 94,700 | |
Family Households | 1,749 | 12,841 | 39,894 | |
Non-Family Households | 7,197 | 28,692 | 54,807 | |
Married Couple | 1,035 | 5,367 | 18,640 | |
Other Family | 714 | 7,474 | 21,254 | |
Married w/Child | 139 | 1,548 | 8,366 | |
Single Male w/Child | 13 | 390 | 1,754 | |
Single Female w/Child | 392 | 3,566 | 8,791 |
Population Change Last Two Decades - Plus Projection
2000 | % | 2010 | % | 2020 | % | 2030 | |
---|---|---|---|---|---|---|---|
Michigan | 9,938,444 | -1 | 9,883,640 | +1 | 10,023,423 | +4 | 10,424,510 |
Wayne County | 2,061,162 | -12 | 1,820,584 | -4 | 1,741,463 | -1 | 1,730,000 |
Total Working Age Population:
Total Households:
Total Working Age Population:
Total Households:
Total Working Age Population:
Total Households: