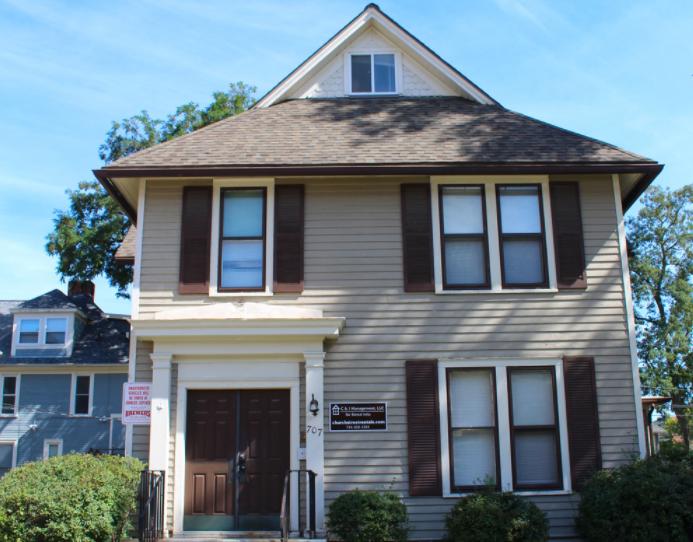
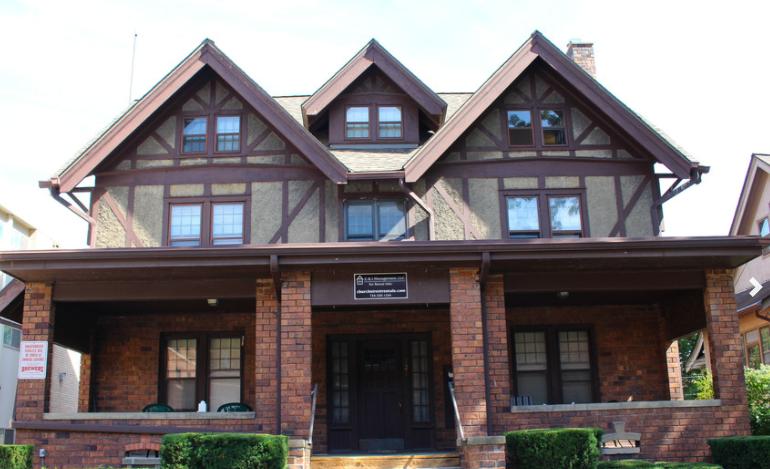
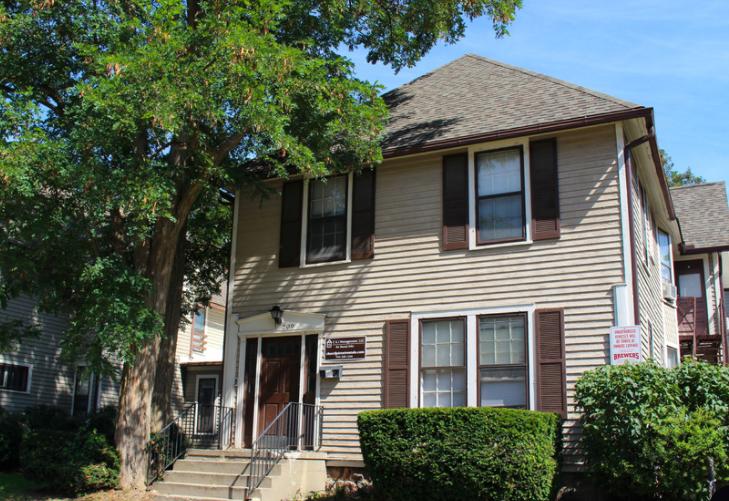
1-Mile | 3-Miles | 5-Miles | ||
---|---|---|---|---|
Total Population | 24,161 | 110,849 | 176,725 | |
Population Median Age | 30 | 34 | 35 | |
Population by Age | 0-9 Yrs | 1340 (5%) | 7522 (6%) | 14756 (8%) |
10-19 Yrs | 4172 (17%) | 17186 (15%) | 25351 (14%) | |
20-29 Yrs | 11493 (47%) | 37999 (34%) | 51011 (28%) | |
30-39 Yrs | 2196 (9%) | 13602 (12%) | 22161 (12%) | |
40-49 Yrs | 1319 (5%) | 8734 (7%) | 16796 (9%) | |
50-59 Yrs | 1294 (5%) | 9030 (8%) | 16908 (9%) | |
60-69 Yrs | 1249 (5%) | 8934 (8%) | 15995 (9%) | |
70+ Yrs | 1099 (4%) | 7842 (7%) | 13746 (7%) | |
Median HH Income | $63,625 | $65,014 | $69,580 | |
Total Household Income | < 24K | 2168 (26%) | 9581 (22%) | 14213 (20%) |
25-49K | 1274 (15%) | 7588 (17%) | 12407 (17%) | |
50-74K | 1153 (14%) | 7012 (16%) | 11105 (15%) | |
75-99K | 858 (10%) | 4609 (10%) | 8288 (11%) | |
100-199K | 1768 (21%) | 9735 (22%) | 16378 (23%) | |
200K+ | 985 (12%) | 4833 (11%) | 8631 (12%) | |
Highest Education Level | No Diploma | 136 | 1807 | 3676 |
Diploma or GED | 470 | 4476 | 8397 | |
Some College | 822 | 6600 | 12143 | |
Assoc. Degree | 387 | 2697 | 5412 | |
Bachelors Degree | 3059 | 18166 | 30440 | |
Higher Degree | 4629 | 26504 | 43711 | |
Total Housing Units | 8,818 | 46,241 | 75,612 | |
--Owner-Occupied | 2,883 | 18,929 | 34,060 | |
--Renter-Occupied | 5,323 | 24,429 | 36,964 | |
Owner-Occupied Values | < 100K | 35 | 1056 | 2114 |
100-199K | 402 | 2938 | 5176 | |
200-299K | 343 | 4239 | 8451 | |
300-399K | 600 | 4130 | 7249 | |
400-499K | 506 | 2707 | 4744 | |
500K+ | 996 | 3860 | 6326 | |
Total Working Age Population | 22,249 | 99,320 | 153,007 | |
In Work Force | 12,335 | 60,900 | 97,992 | |
Not In Work Force | 9,915 | 38,421 | 55,014 | |
Workforce Employed | 11,728 | 58,366 | 94,302 | |
Workforce Unemployed | 607 | 2,500 | 3,631 | |
Civlian Workforce | 12,335 | 60,866 | 97,932 | |
Military Workforce | 0 | 34 | 60 | |
Total Households | 8,206 | 43,358 | 71,024 | |
Family Households | 2,815 | 18,576 | 34,380 | |
Non-Family Households | 5,391 | 24,782 | 36,644 | |
Married Couple | 2,282 | 15,015 | 27,768 | |
Other Family | 533 | 3,561 | 6,612 | |
Married w/Child | 944 | 5,774 | 11,321 | |
Single Male w/Child | 67 | 409 | 779 | |
Single Female w/Child | 135 | 1,142 | 2,320 |
Population Change Last Two Decades - Plus Projection
2000 | % | 2010 | % | 2020 | % | 2030 | |
---|---|---|---|---|---|---|---|
Michigan | 9,938,444 | -1 | 9,883,640 | +1 | 10,023,423 | +4 | 10,424,510 |
Washtenaw County | 322,895 | +7 | 344,791 | +9 | 376,857 | +12 | 422,684 |
Total Working Age Population:
Total Households:
Total Working Age Population:
Total Households:
Total Working Age Population:
Total Households: