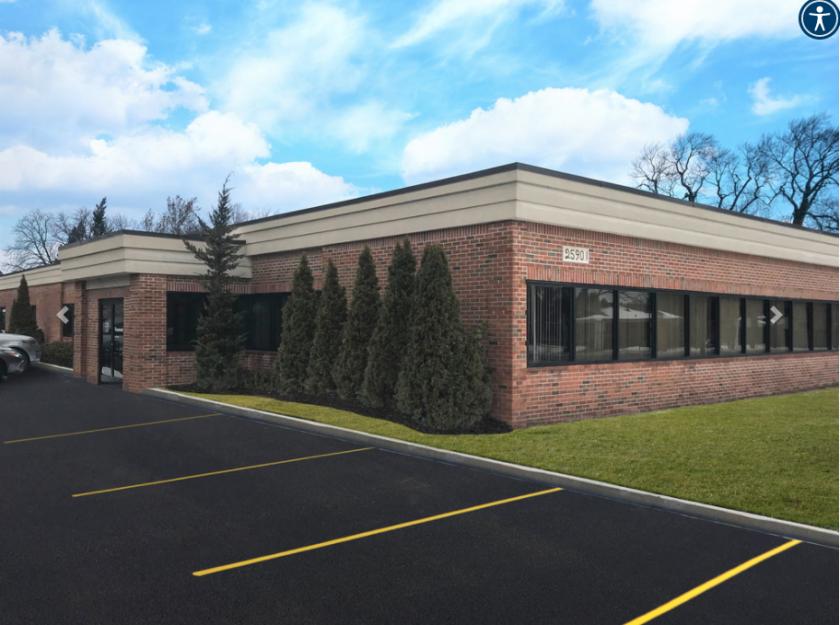
10,138 SF one-story office building situated on 0.91 acres
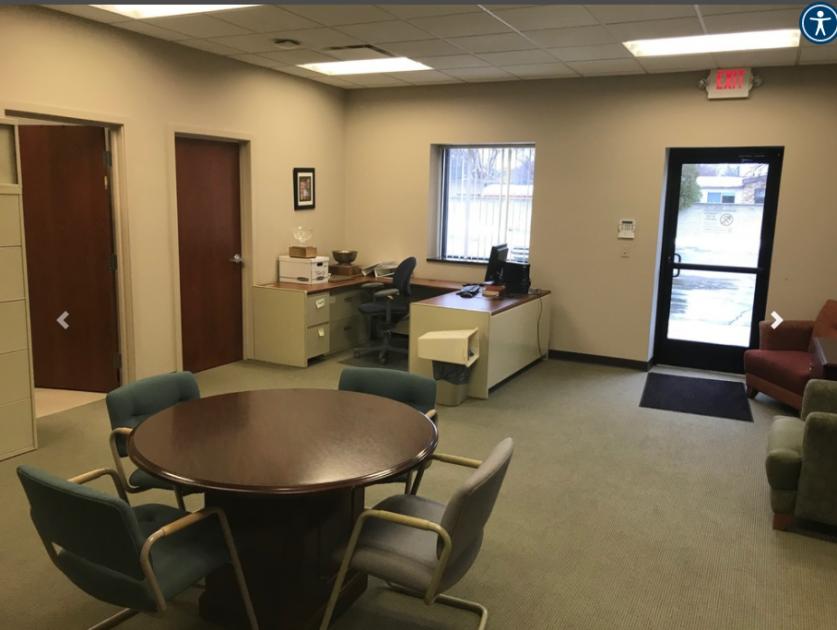
Completely rebuilt in 2011, including new interior, exterior and mechanicals
Currently built out as general office
Possible uses include; medical, clinic, credit union/bank, sales office, and professional service establishments
10 ft ceilings throughout
70-car parking lot
Zoning O-1, Office Service District
Corner site with Jefferson Avenue and Lakeland Street frontage
Lease rate: $15.50-$18.50 PSF | Sale price: $1,550,000
No part of this information may be copied, reproduced, repurposed, or screen-captured for any commercial purpose without prior written authorization from MyEListing.
While we strive to provide the most accurate information, all listing information, and demographic data, is provided by third-parties. As such, MyEListing will not be responsible for the accuracy of the information. It is strongly recommended that you verify all information with the listing agent, and any relevant agencies, prior to making any decisions.
What is the asking price for 25901 Jefferson Avenue in St Clair Shores?
The asking price for 25901 Jefferson Avenue is $1,550,000
What is the building size of this Office property in St Clair Shores, MI?
The size of the building/unit at 25901 Jefferson Avenue in St Clair Shores is 10,138 square feet
What kind of Office is the propery at 25901 Jefferson Avenue?
The property at 25901 Jefferson Avenue St Clair Shores, MI 48081 is listed as a Medical Office property
What is the population within 1 mile of 25901 Jefferson Avenue in St Clair Shores?
The population within 1 mile of 25901 Jefferson Avenue St Clair Shores, MI 48081 is 14,923 people.
Who do I contact for questions about 25901 Jefferson Avenue?
You should contact the listing agent,
Todd Hawley, for any details regarding this commercial listing.