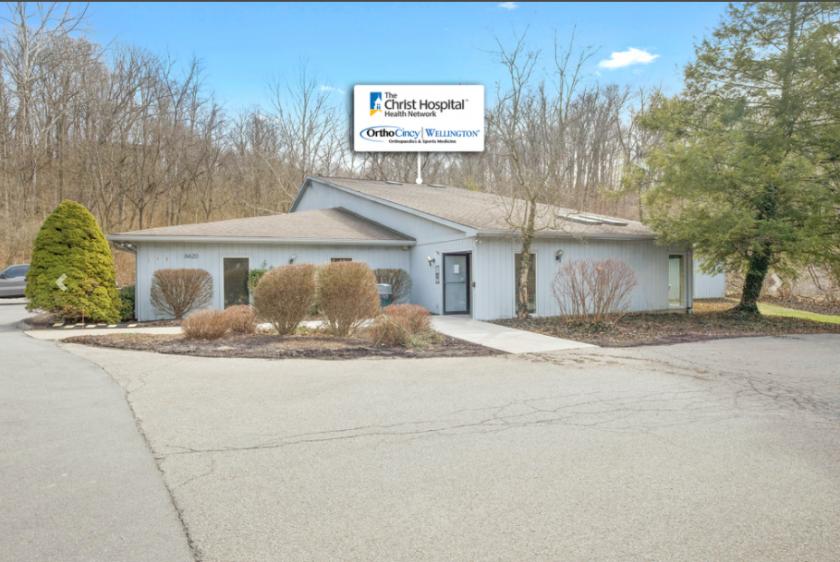
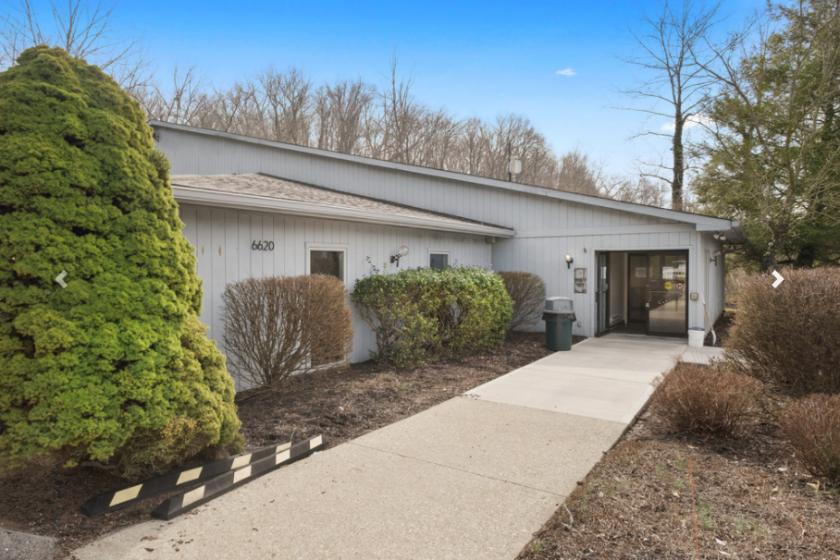
NNN Single-Tenant Corporate Guaranteed Medical Office facility located in Cincinnati, OH
Christ Hospital guarantee (revenue of $2.8 Billion, 6,500 employee hospital network)
Affiliate sublease to OrthoCincy Wellington (Orthopedic & Sports Medicine)
Specialized facility with 16 exam suites and brand new X¬Ray imaging room
Strategically located 10-miles from Christ Hospital's main campus
±135,000 people reside within 5-miles of the subject property with avg household incomes >$100k/year
Lease Expiration: 4/14/2025 (2.25% annual rent increases)
Asking Price: $1,350,000 / 7.20% Cap
No part of this information may be copied, reproduced, repurposed, or screen-captured for any commercial purpose without prior written authorization from MyEListing.
While we strive to provide the most accurate information, all listing information, and demographic data, is provided by third-parties. As such, MyEListing will not be responsible for the accuracy of the information. It is strongly recommended that you verify all information with the listing agent, and any relevant agencies, prior to making any decisions.
What is the asking price for 6620 Clough Pike in Cincinnati?
The asking price for 6620 Clough Pike is $1,350,000
What is the building size of this Health Care property in Cincinnati, OH?
The size of the building/unit at 6620 Clough Pike in Cincinnati is 8,546 square feet
What kind of Health Care is the propery at 6620 Clough Pike?
The property at 6620 Clough Pike Cincinnati, OH 45244 is listed as a Hospital/Clinic Health Care property
What is the population within 1 mile of 6620 Clough Pike in Cincinnati?
The population within 1 mile of 6620 Clough Pike Cincinnati, OH 45244 is 8,532 people.
Who do I contact for questions about 6620 Clough Pike?
You should contact the listing agent,
Steven Silverman, for any details regarding this commercial listing.