Industrial Properties
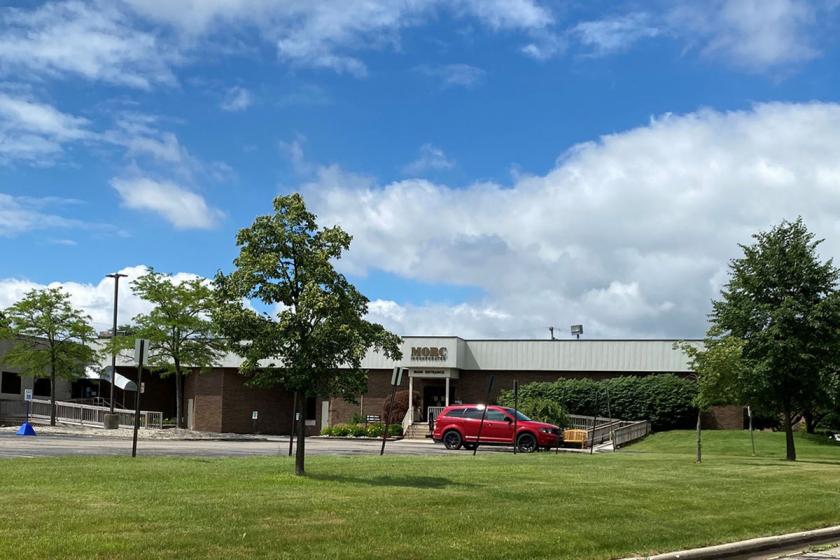
1270 Doris Road Auburn Hills, MI 48326
1270 Doris Road Auburn Hills, MI 48326
Details & Description
Listing Agents

Joe Banyai
O: 248-948-0108
M: 248-515-2152
jbanyai@signatureassociates.com
O: 248-948-0108
M: 248-515-2152
jbanyai@signatureassociates.com
While we strive to provide the most accurate information, all listing information, and demographic data, is provided by third-parties. As such, MyEListing will not be responsible for the accuracy of the information. It is strongly recommended that you verify all information with the listing agent, and any relevant agencies, prior to making any decisions.