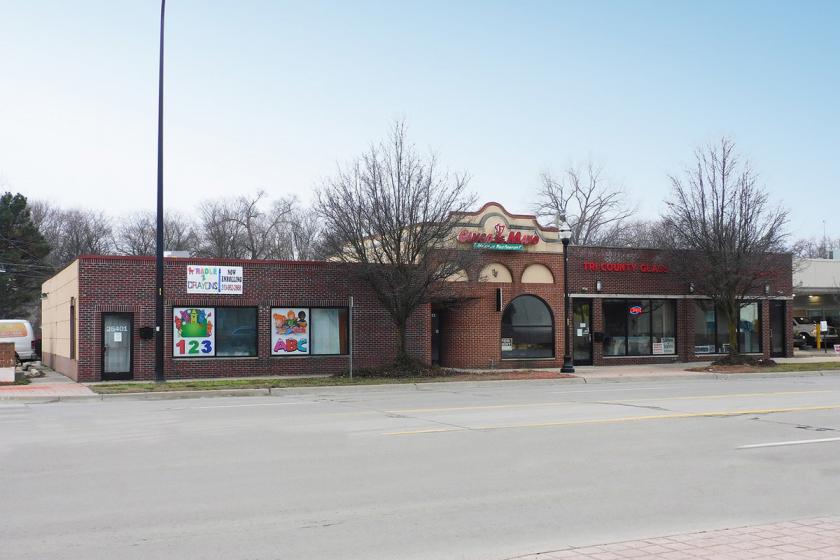
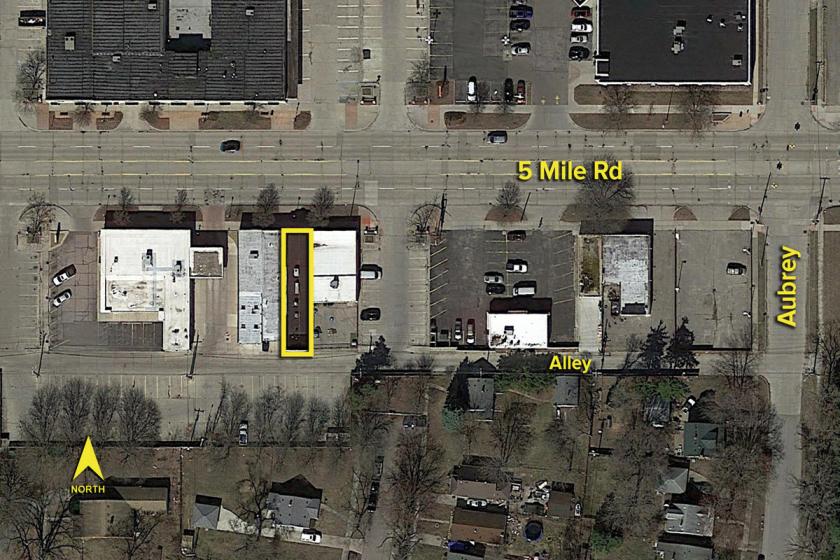
1-Mile | 3-Miles | 5-Miles | ||
---|---|---|---|---|
Total Population | 10,828 | 105,372 | 307,418 | |
Population Median Age | 38 | 38 | 39 | |
Population by Age | 0-9 Yrs | 1534 (14%) | 13830 (13%) | 40367 (13%) |
10-19 Yrs | 1119 (10%) | 13234 (12%) | 39061 (12%) | |
20-29 Yrs | 1489 (13%) | 14921 (14%) | 42783 (13%) | |
30-39 Yrs | 1496 (13%) | 12264 (11%) | 36236 (11%) | |
40-49 Yrs | 1505 (13%) | 15130 (14%) | 39636 (12%) | |
50-59 Yrs | 1632 (15%) | 14512 (13%) | 42331 (13%) | |
60-69 Yrs | 1216 (11%) | 12422 (11%) | 36863 (11%) | |
70+ Yrs | 836 (7%) | 9060 (8%) | 30142 (9%) | |
Median HH Income | $53,871 | $46,194 | $47,252 | |
Total Household Income | < 24K | 903 (21%) | 11043 (26%) | 32355 (26%) |
25-49K | 1086 (25%) | 11161 (26%) | 30863 (25%) | |
50-74K | 729 (17%) | 7326 (17%) | 21713 (17%) | |
75-99K | 656 (15%) | 5312 (12%) | 14527 (12%) | |
100-199K | 816 (19%) | 6337 (15%) | 18768 (15%) | |
200K+ | 43 (1%) | 671 (1%) | 2680 (2%) | |
Highest Education Level | No Diploma | 842 | 8405 | 23814 |
Diploma or GED | 2377 | 22514 | 62999 | |
Some College | 1756 | 19114 | 55521 | |
Assoc. Degree | 725 | 6610 | 20256 | |
Bachelors Degree | 1171 | 9793 | 29317 | |
Higher Degree | 563 | 5104 | 16763 | |
Total Housing Units | 4,688 | 47,379 | 137,660 | |
--Owner-Occupied | 2,916 | 27,186 | 78,919 | |
--Renter-Occupied | 1,317 | 14,664 | 41,987 | |
Owner-Occupied Values | < 100K | 1686 | 15750 | 39052 |
100-199K | 1113 | 9163 | 29454 | |
200-299K | 99 | 1703 | 7666 | |
300-399K | 6 | 299 | 1739 | |
400-499K | 2 | 110 | 421 | |
500K+ | 11 | 161 | 588 | |
Total Working Age Population | 8,618 | 83,725 | 243,525 | |
In Work Force | 5,724 | 53,102 | 148,298 | |
Not In Work Force | 2,894 | 30,622 | 95,227 | |
Workforce Employed | 5,313 | 47,515 | 134,286 | |
Workforce Unemployed | 410 | 5,586 | 14,002 | |
Civlian Workforce | 5,724 | 53,101 | 148,288 | |
Military Workforce | 0 | 1 | 9 | |
Total Households | 4,233 | 41,850 | 120,906 | |
Family Households | 2,565 | 25,196 | 74,489 | |
Non-Family Households | 1,668 | 16,654 | 46,417 | |
Married Couple | 1,551 | 13,873 | 41,442 | |
Other Family | 1,014 | 11,324 | 33,047 | |
Married w/Child | 434 | 5,124 | 14,972 | |
Single Male w/Child | 121 | 1,203 | 3,028 | |
Single Female w/Child | 460 | 4,725 | 13,073 |
Population Change Last Two Decades - Plus Projection
2000 | % | 2010 | % | 2020 | % | 2030 | |
---|---|---|---|---|---|---|---|
Michigan | 9,938,444 | -1 | 9,883,640 | +1 | 10,023,423 | +4 | 10,424,510 |
Oakland County | 1,194,156 | +1 | 1,202,362 | +5 | 1,264,515 | +7 | 1,350,052 |
Wayne County | 2,061,162 | -12 | 1,820,584 | -4 | 1,741,463 | -1 | 1,730,000 |
Total Working Age Population:
Total Households:
Total Working Age Population:
Total Households:
Total Working Age Population:
Total Households: