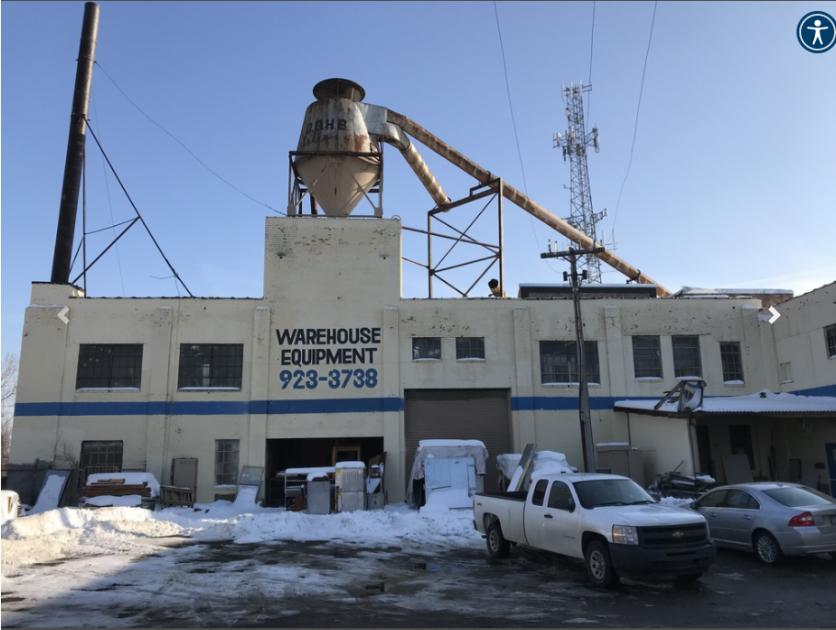
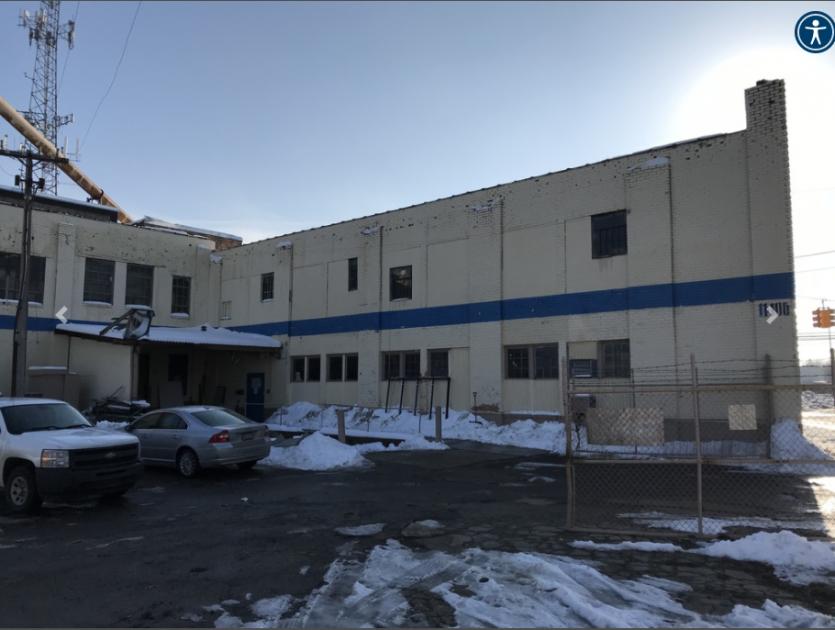
70,000 SF industrial building for sale or lease
Potential Green Zone approved building
2 Story facility with 35,000 SF on each floor
Caterpillar 450 KVA on wheel generator included
Cell tower located on property with lease options through 2024
Present income on tower is $2,963.30/mo with 4% annual increases
$2,450,000 Purchase price for building and tower income
Lease rate: $3.00/SF Gross
Preferred to be sold together, will entertain building offers without the tower
No part of this information may be copied, reproduced, repurposed, or screen-captured for any commercial purpose without prior written authorization from MyEListing.
While we strive to provide the most accurate information, all listing information, and demographic data, is provided by third-parties. As such, MyEListing will not be responsible for the accuracy of the information. It is strongly recommended that you verify all information with the listing agent, and any relevant agencies, prior to making any decisions.
What is the asking price for 11400 Shoemaker Street in Detroit?
The asking price for 11400 Shoemaker Street is $2,450,000
What is the building size of this Industrial property in Detroit, MI?
The size of the building/unit at 11400 Shoemaker Street in Detroit is 70,000 square feet
What kind of Industrial is the propery at 11400 Shoemaker Street?
The property at 11400 Shoemaker Street Detroit, MI 48213 is listed as a Warehouse Industrial property
What is the population within 1 mile of 11400 Shoemaker Street in Detroit?
The population within 1 mile of 11400 Shoemaker Street Detroit, MI 48213 is 8,722 people.
Who do I contact for questions about 11400 Shoemaker Street?
You should contact the listing agent,
Mike Koenigbauer, for any details regarding this commercial listing.