Can be expanded on current site to 80,000 SF
Paramount lease runs through June 30, 2022 ($56,250/month (NNN) - $675,000 annual rent)
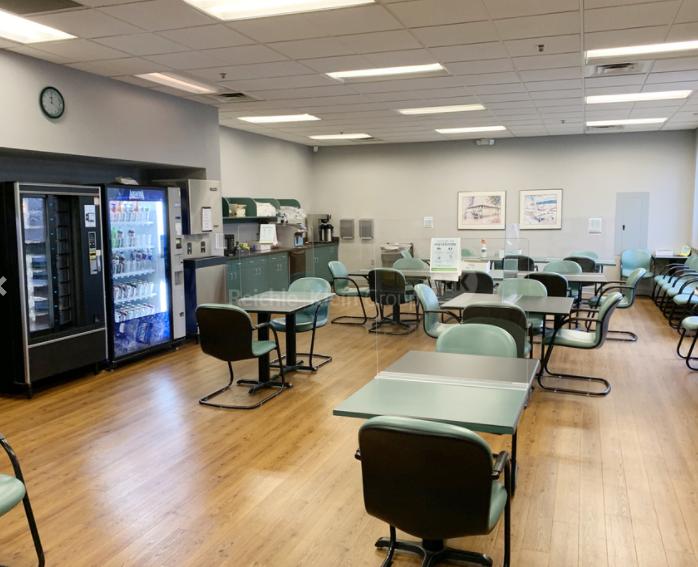
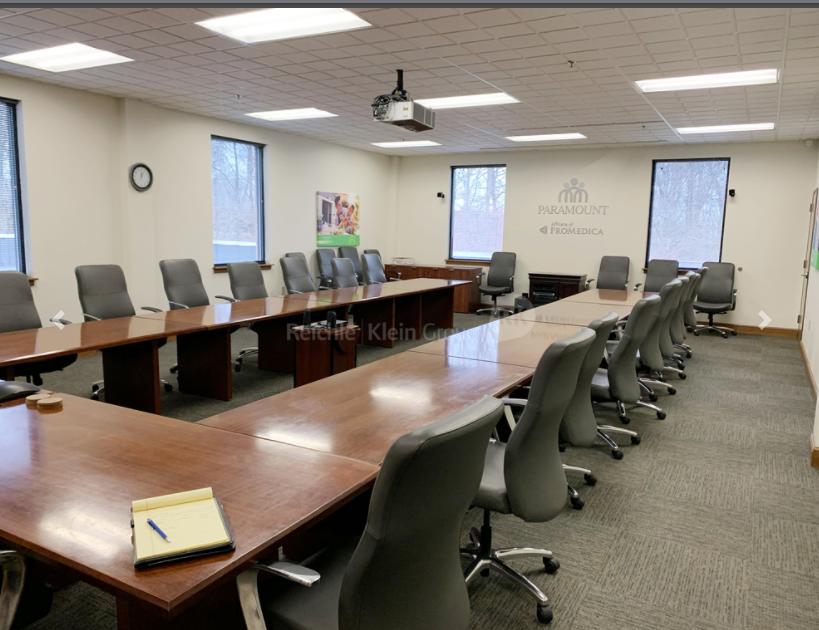
Furniture/cubicles available
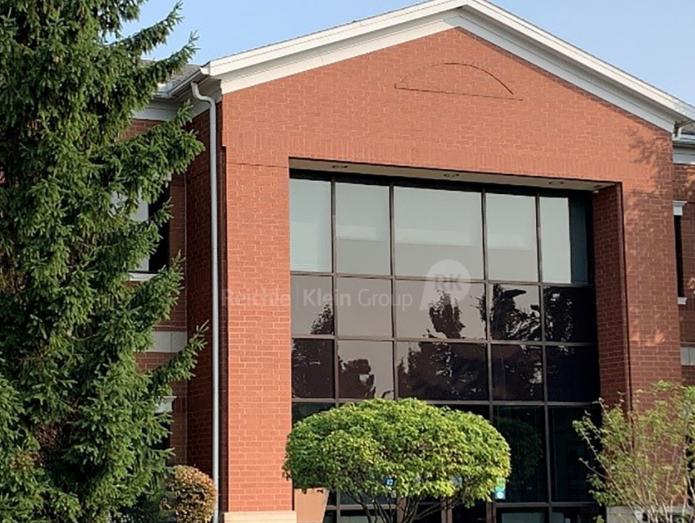
Call center/headquarters building
Available for sale at $4,750,000
Direct access to Edward J. Epstein Park walking trails
Local incentives available from Maumee
250-person auditorium
Highly visible
Landmark property
Less than a mile to I-475/US-23 interchange
Approximately 1.3 miles to Ohio Turnpike (I-80/90) interchange
Raised floor in computer room
Overhead door into warehouse/storage area (950 SF)
No part of this information may be copied, reproduced, repurposed, or screen-captured for any commercial purpose without prior written authorization from MyEListing.
While we strive to provide the most accurate information, all listing information, and demographic data, is provided by third-parties. As such, MyEListing will not be responsible for the accuracy of the information. It is strongly recommended that you verify all information with the listing agent, and any relevant agencies, prior to making any decisions.
What is the asking price for 1901 Indian Wood Circle in Maumee?
The asking price for 1901 Indian Wood Circle is $11.00 a SF per Year
What is the building size of this commercial Office property?
The size of this lease property at '.1901 Indian Wood Circle.' is 60162 square feet
What kind of Office is the propery at 1901 Indian Wood Circle?
The property at 1901 Indian Wood Circle Maumee, OH 43537 is listed as a Professional Office property
What is the population within 1 mile of 1901 Indian Wood Circle in Maumee?
The population within 1 mile of 1901 Indian Wood Circle Maumee, OH 43537 is 4,893 people.
Who do I contact for questions about 1901 Indian Wood Circle?
You should contact the listing agent,
Marty Gallagher, for any details regarding this commercial listing.