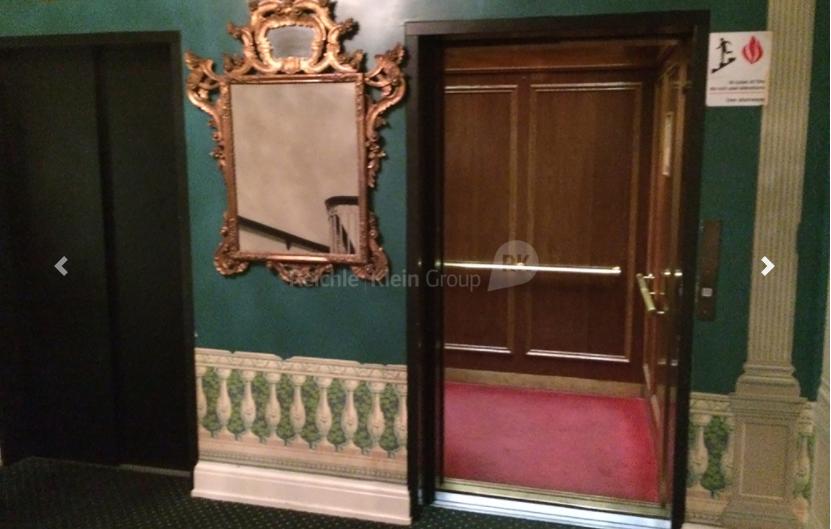
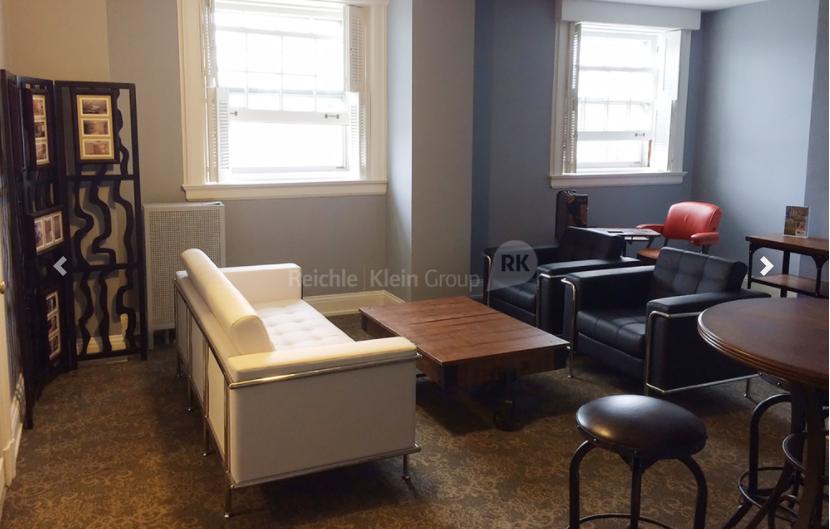
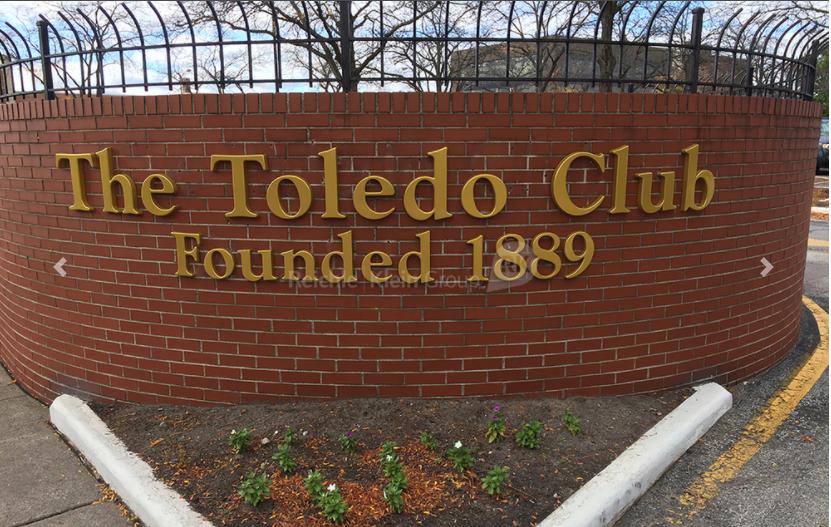
1-Mile | 3-Miles | 5-Miles | ||
---|---|---|---|---|
Total Population | 11,794 | 100,478 | 221,462 | |
Population Median Age | 36 | 36 | 36 | |
Population by Age | 0-9 Yrs | 1613 (13%) | 15057 (14%) | 30252 (13%) |
10-19 Yrs | 1496 (12%) | 14801 (14%) | 31311 (14%) | |
20-29 Yrs | 2140 (18%) | 14706 (14%) | 35982 (16%) | |
30-39 Yrs | 1429 (12%) | 13180 (13%) | 28501 (12%) | |
40-49 Yrs | 1457 (12%) | 12383 (12%) | 25954 (11%) | |
50-59 Yrs | 1693 (14%) | 13330 (13%) | 28400 (12%) | |
60-69 Yrs | 1255 (10%) | 10170 (10%) | 23260 (10%) | |
70+ Yrs | 711 (6%) | 6851 (6%) | 17803 (8%) | |
Median HH Income | $17,215 | $27,529 | $36,942 | |
Total Household Income | < 24K | 3493 (63%) | 19385 (46%) | 32926 (35%) |
25-49K | 974 (17%) | 10946 (26%) | 23927 (26%) | |
50-74K | 511 (9%) | 5734 (13%) | 14878 (16%) | |
75-99K | 243 (4%) | 2977 (7%) | 9169 (9%) | |
100-199K | 232 (4%) | 2152 (5%) | 9607 (10%) | |
200K+ | 86 (1%) | 365 (0%) | 1349 (1%) | |
Highest Education Level | No Diploma | 1955 | 13368 | 21282 |
Diploma or GED | 2621 | 23464 | 48335 | |
Some College | 1656 | 14915 | 34413 | |
Assoc. Degree | 569 | 5204 | 13080 | |
Bachelors Degree | 650 | 4662 | 16166 | |
Higher Degree | 408 | 2321 | 8872 | |
Total Housing Units | 7,048 | 53,877 | 109,386 | |
--Owner-Occupied | 1,015 | 18,283 | 46,602 | |
--Renter-Occupied | 4,524 | 23,276 | 45,254 | |
Owner-Occupied Values | < 100K | 678 | 15637 | 31058 |
100-199K | 230 | 1916 | 12373 | |
200-299K | 59 | 352 | 1727 | |
300-399K | 22 | 199 | 677 | |
400-499K | 5 | 71 | 278 | |
500K+ | 21 | 107 | 489 | |
Total Working Age Population | 9,300 | 76,317 | 173,166 | |
In Work Force | 4,515 | 43,389 | 106,809 | |
Not In Work Force | 4,785 | 32,929 | 66,357 | |
Workforce Employed | 3,680 | 37,229 | 95,996 | |
Workforce Unemployed | 834 | 6,159 | 10,666 | |
Civlian Workforce | 4,515 | 43,387 | 106,662 | |
Military Workforce | 0 | 1 | 147 | |
Total Households | 5,540 | 41,559 | 91,856 | |
Family Households | 2,162 | 22,667 | 51,180 | |
Non-Family Households | 3,378 | 18,893 | 40,676 | |
Married Couple | 539 | 9,117 | 26,555 | |
Other Family | 1,623 | 13,550 | 24,625 | |
Married w/Child | 130 | 3,139 | 9,706 | |
Single Male w/Child | 91 | 1,865 | 3,305 | |
Single Female w/Child | 977 | 6,399 | 11,447 |
Population Change Last Two Decades - Plus Projection
2000 | % | 2010 | % | 2020 | % | 2030 | |
---|---|---|---|---|---|---|---|
Michigan | 9,938,444 | -1 | 9,883,640 | +1 | 10,023,423 | +4 | 10,424,510 |
Monroe County | 145,945 | +4 | 152,021 | -2 | 149,610 | +2 | 153,038 |
Ohio | 11,353,140 | +2 | 11,536,504 | 0 | 11,574,870 | 0 | 11,615,100 |
Lucas County | 455,054 | -3 | 441,815 | -3 | 430,450 | -2 | 420,080 |
Wood County | 121,065 | +4 | 125,488 | +4 | 130,870 | +3 | 134,280 |
Total Working Age Population:
Total Households:
Total Working Age Population:
Total Households:
Total Working Age Population:
Total Households: