Specialty Real Estate
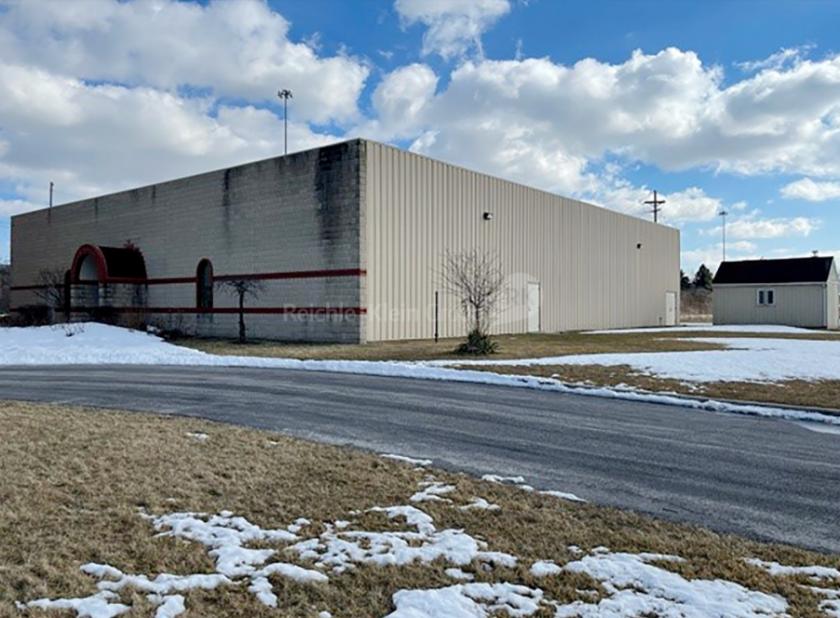
740 Glenwood Road Rossford, OH 43460
740 Glenwood Road Rossford, OH 43460
Details & Description
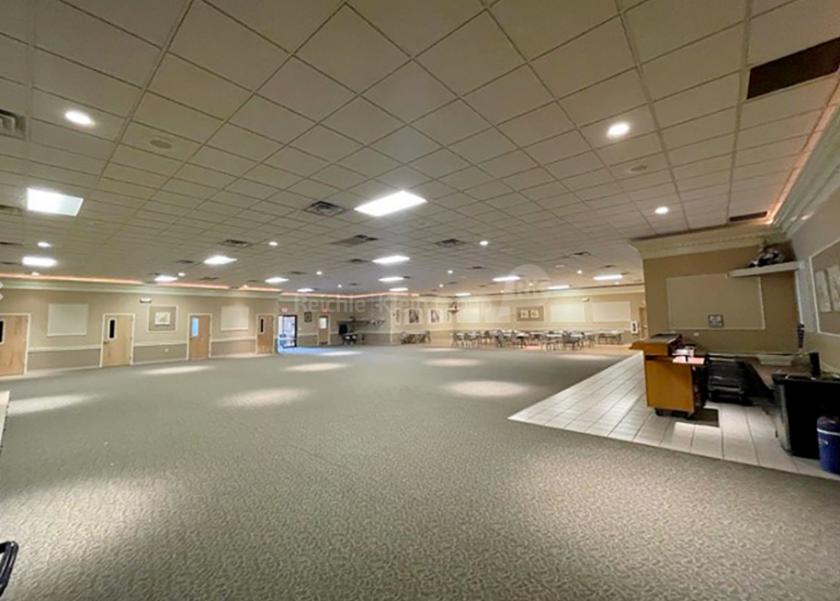
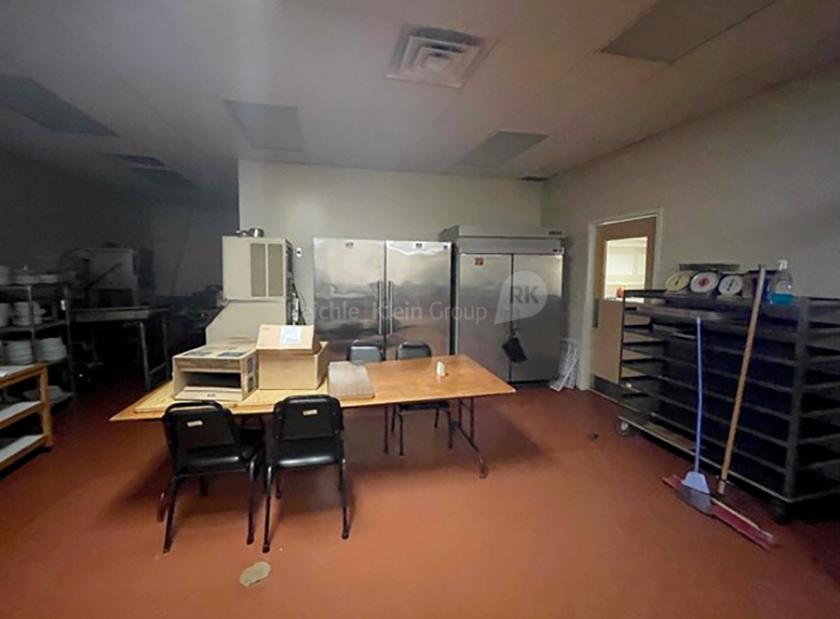
Additional Photos

Listing Agents

John Sluhan
O: 419-283-9634
M: 419-283-9634
jsluhan@rkgcommercial.com
O: 419-283-9634
M: 419-283-9634
jsluhan@rkgcommercial.com
While we strive to provide the most accurate information, all listing information, and demographic data, is provided by third-parties. As such, MyEListing will not be responsible for the accuracy of the information. It is strongly recommended that you verify all information with the listing agent, and any relevant agencies, prior to making any decisions.


