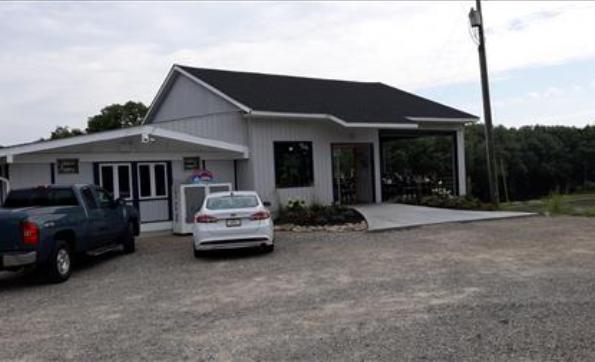
1-Mile | 3-Miles | 5-Miles | ||
---|---|---|---|---|
Total Population | 1,260 | 11,973 | 20,290 | |
Population Median Age | 39 | 39 | 40 | |
Population by Age | 0-9 Yrs | 194 (15%) | 1533 (12%) | 2405 (11%) |
10-19 Yrs | 111 (8%) | 1335 (11%) | 2260 (11%) | |
20-29 Yrs | 197 (15%) | 1909 (15%) | 2847 (14%) | |
30-39 Yrs | 129 (10%) | 1688 (14%) | 2554 (12%) | |
40-49 Yrs | 153 (12%) | 1401 (11%) | 2534 (12%) | |
50-59 Yrs | 182 (14%) | 1436 (11%) | 2773 (13%) | |
60-69 Yrs | 203 (16%) | 1446 (12%) | 2699 (13%) | |
70+ Yrs | 92 (7%) | 1226 (10%) | 2217 (10%) | |
Median HH Income | $76,799 | $46,917 | $56,708 | |
Total Household Income | < 24K | 105 (21%) | 1380 (29%) | 2068 (25%) |
25-49K | 56 (11%) | 1044 (22%) | 1552 (19%) | |
50-74K | 69 (14%) | 754 (16%) | 1439 (17%) | |
75-99K | 132 (27%) | 681 (14%) | 1246 (15%) | |
100-199K | 104 (21%) | 608 (13%) | 1370 (16%) | |
200K+ | 14 (2%) | 202 (4%) | 396 (4%) | |
Highest Education Level | No Diploma | 57 | 1182 | 1710 |
Diploma or GED | 417 | 3501 | 5759 | |
Some College | 124 | 1464 | 2785 | |
Assoc. Degree | 82 | 648 | 1097 | |
Bachelors Degree | 114 | 959 | 1840 | |
Higher Degree | 44 | 417 | 1001 | |
Total Housing Units | 525 | 5,240 | 8,886 | |
--Owner-Occupied | 329 | 2,643 | 5,351 | |
--Renter-Occupied | 152 | 2,024 | 2,720 | |
Owner-Occupied Values | < 100K | 51 | 651 | 1027 |
100-199K | 229 | 1537 | 2965 | |
200-299K | 36 | 288 | 751 | |
300-399K | 6 | 65 | 316 | |
400-499K | 5 | 32 | 101 | |
500K+ | 2 | 69 | 190 | |
Total Working Age Population | 992 | 9,636 | 16,500 | |
In Work Force | 676 | 6,100 | 10,724 | |
Not In Work Force | 316 | 3,536 | 5,776 | |
Workforce Employed | 651 | 5,868 | 10,348 | |
Workforce Unemployed | 24 | 232 | 362 | |
Civlian Workforce | 676 | 6,099 | 10,710 | |
Military Workforce | 0 | 1 | 14 | |
Total Households | 480 | 4,667 | 8,072 | |
Family Households | 366 | 2,887 | 5,291 | |
Non-Family Households | 114 | 1,780 | 2,781 | |
Married Couple | 307 | 1,903 | 3,722 | |
Other Family | 59 | 984 | 1,569 | |
Married w/Child | 131 | 728 | 1,345 | |
Single Male w/Child | 18 | 245 | 404 | |
Single Female w/Child | 17 | 310 | 416 |
Population Change Last Two Decades - Plus Projection
2000 | % | 2010 | % | 2020 | % | 2030 | |
---|---|---|---|---|---|---|---|
Indiana | 6,080,485 | +7 | 6,483,802 | +4 | 6,738,573 | +4 | 7,014,880 |
Dearborn County | 46,109 | +9 | 50,047 | -1 | 49,589 | +4 | 51,753 |
Ohio County | 5,623 | +9 | 6,128 | -4 | 5,905 | +1 | 5,985 |
Kentucky | 4,041,769 | +7 | 4,339,367 | +4 | 4,533,464 | +4 | 4,726,382 |
Boone County | 85,991 | +38 | 118,811 | +17 | 139,018 | +18 | 163,722 |
Ohio | 11,353,140 | +2 | 11,536,504 | 0 | 11,574,870 | 0 | 11,615,100 |
Hamilton County | 845,303 | -5 | 802,374 | -1 | 790,600 | -1 | 785,900 |
Total Working Age Population:
Total Households:
Total Working Age Population:
Total Households:
Total Working Age Population:
Total Households: