Industrial Properties
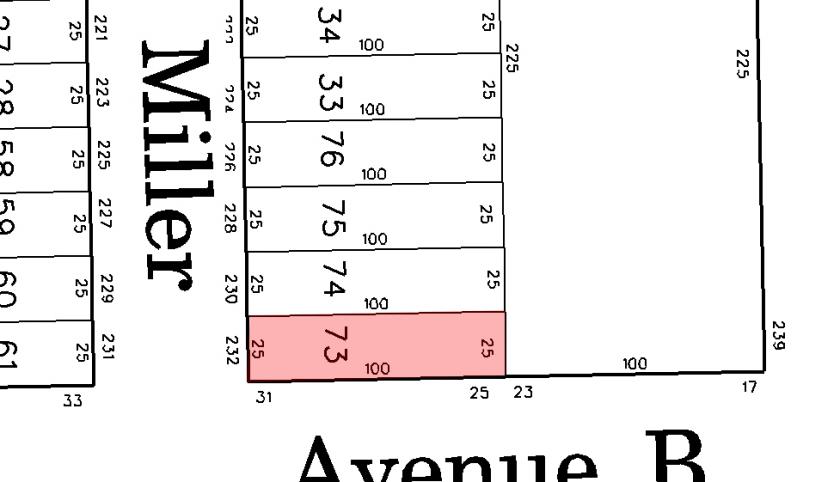
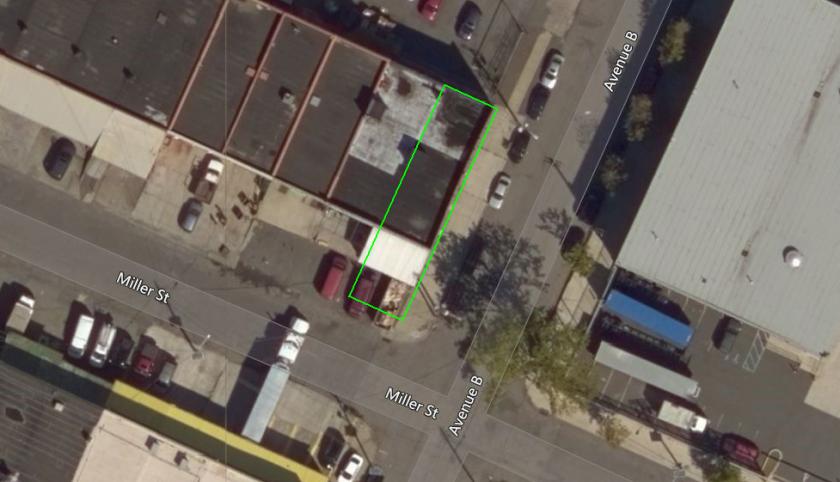
232 Miller Street Newark, NJ 07114
232 Miller Street Newark, NJ 07114

Details & Description
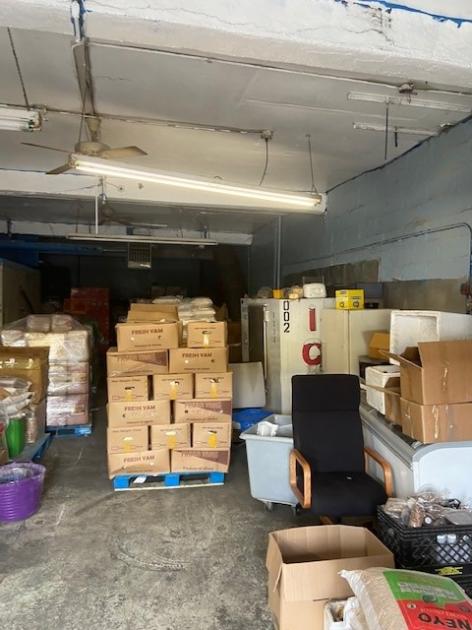
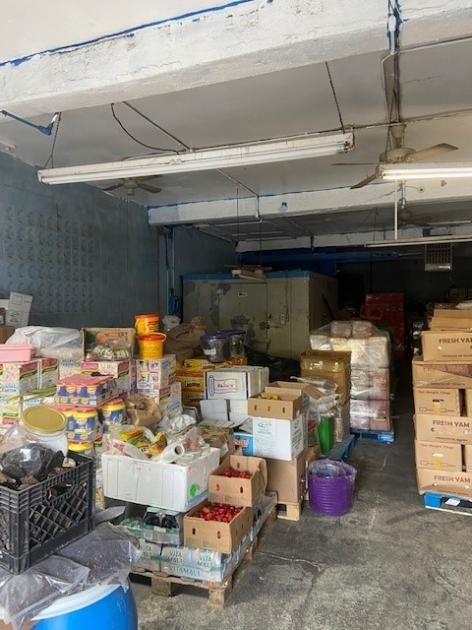
Additional Photos
Listing Agents

Brian DiPinto
O: 973-973-6644
bdipinto@blauberg.com
O: 973-973-6644
bdipinto@blauberg.com

Jason M. Crimmins
O: 973-379-6644
M: 973-568-6611
jmcrimmins@blauberg.com
O: 973-379-6644
M: 973-568-6611
jmcrimmins@blauberg.com
While we strive to provide the most accurate information, all listing information, and demographic data, is provided by third-parties. As such, MyEListing will not be responsible for the accuracy of the information. It is strongly recommended that you verify all information with the listing agent, and any relevant agencies, prior to making any decisions.


